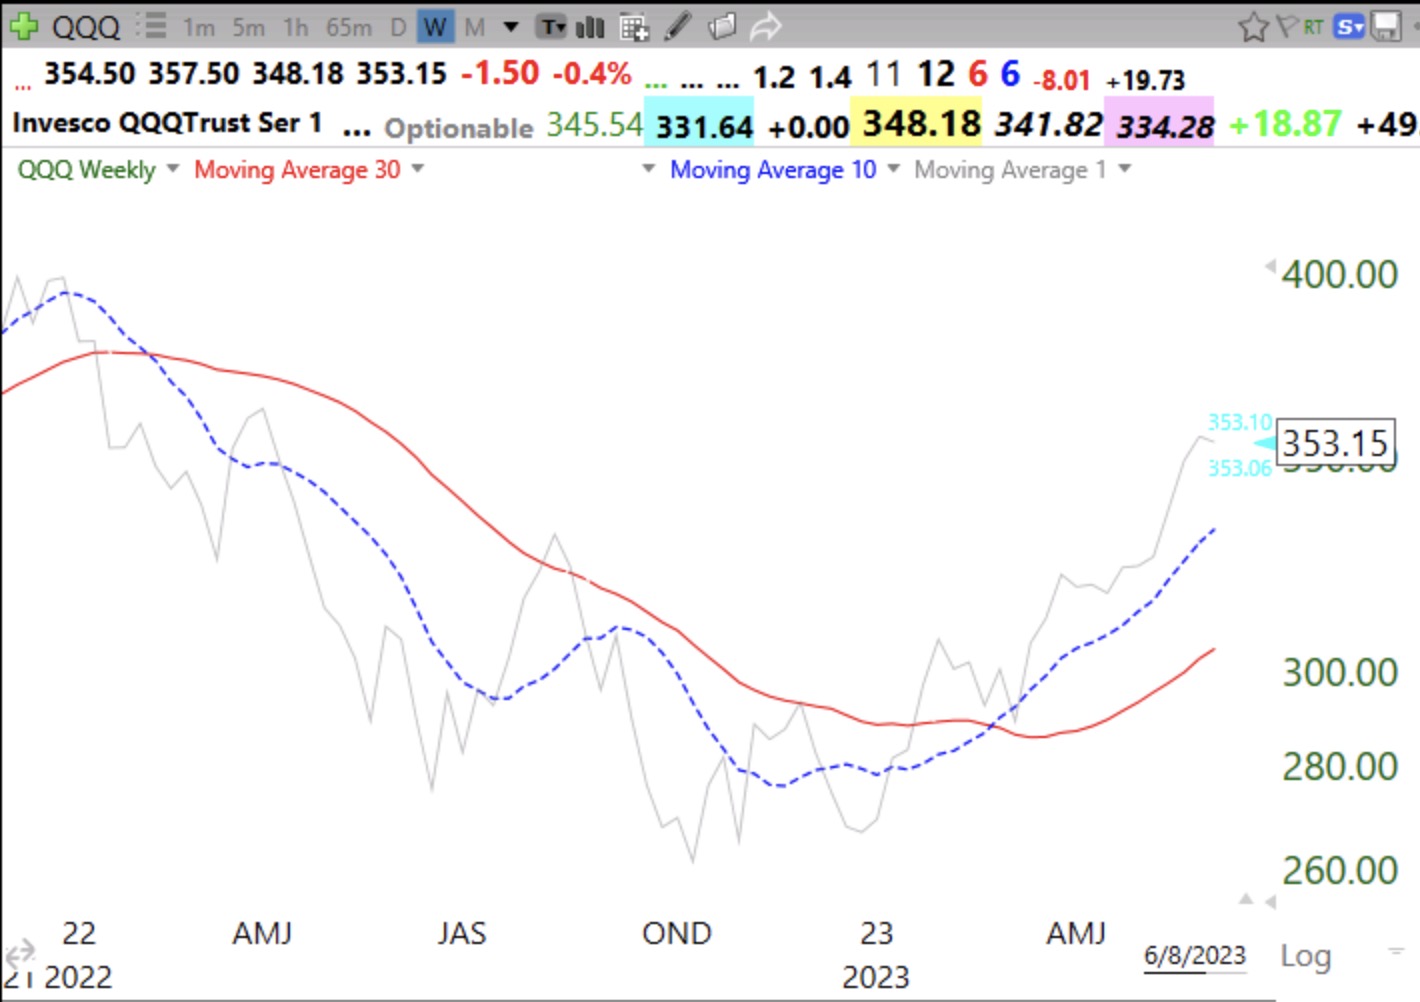
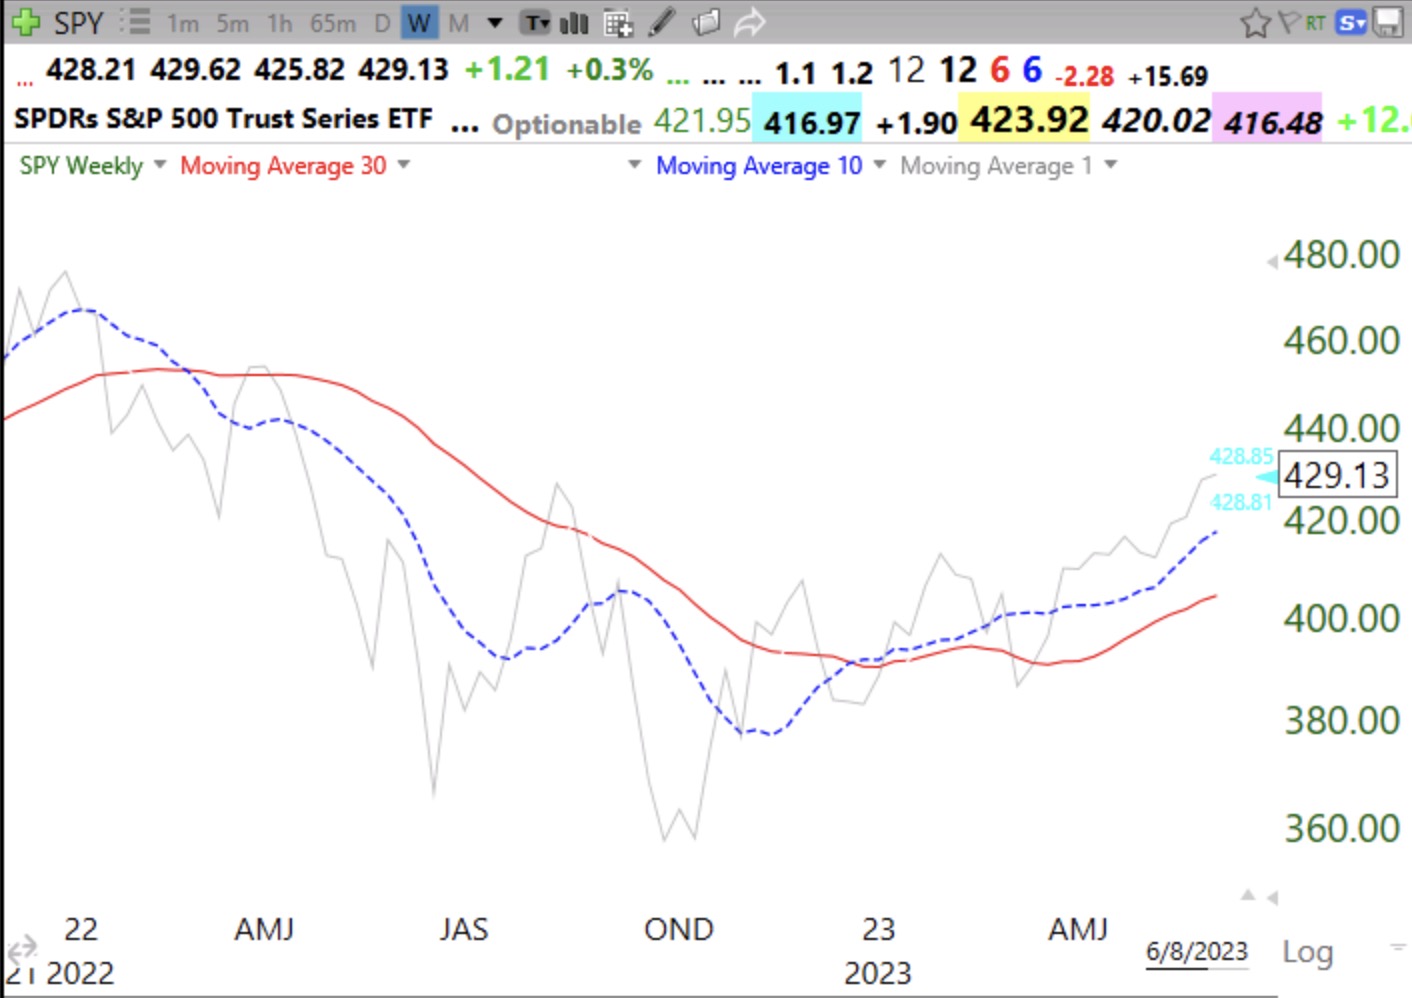
See the 10 week average (dotted line) rising above the rising 30 week average (red line). Gray line is weekly close.
Share this:
- Click to email a link to a friend (Opens in new window) Email
- Click to share on Facebook (Opens in new window) Facebook
- Click to share on X (Opens in new window) X
- Click to share on LinkedIn (Opens in new window) LinkedIn
- Click to print (Opens in new window) Print
- More
- Click to share on Pocket (Opens in new window) Pocket
- Click to share on Pinterest (Opens in new window) Pinterest
- Click to share on Tumblr (Opens in new window) Tumblr
- Click to share on Reddit (Opens in new window) Reddit
- Click to share on Telegram (Opens in new window) Telegram
- Click to share on WhatsApp (Opens in new window) WhatsApp
Hi,
Thanks for sharing your GLB. If the GLB breakout is working and prices keep rising, when do we sell? Is it set a target price, or sell after a time duration, etc?
You have to make your own rules. Sell at a target gain. Sell half and move stop up to break even on rest. Sell if it closes below 10 week average…..Look at the chart and sell when action becomes abnormal. One of my best: when my internal voice says this is too easy after a large rise.