To my visitors: I am only one trader, not a guru, and not a financial advisor. I am presenting my own opinions and my own experiences and people are welcome to decide for themselves what, if anything, on this site is of value to them. Please refer to the additional comments, highlighted in red, at the end of this post.
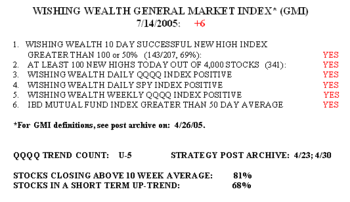
I thought I would begin by looking over the changes in the GMI the last few weeks. 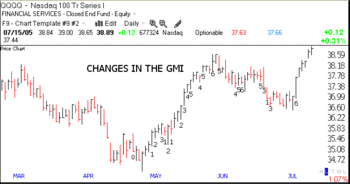 After falling to +3, the GMI has remained at +6 since July 8 when this rally began. It took only one day for the GMI to go from +3 to +6. This is an example of how bad it is to marry a scenario. When the instruments tell me the market is reversing direction, I must act on it and not fight it. I am comfortable now being long and having no shorts. The rally has now completed its 6th day. (Click on chart to enlarge.)……………………………
I am introducing a new chart, the WishingWealth Pulse of the Market (WPM), which I will update periodically. I thought it was important to track how various types of stock indexes are performing. 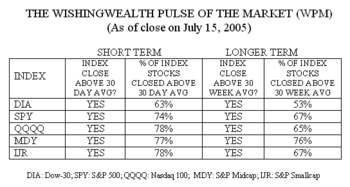 The WPM looks at the Dow 30, S&P 500, Nasdaq 100, S&P 400 (mid-cap) and S&P 600 stock (small-cap) indexes and their component stocks. The short term trend measures focus on whether the index closed above its 30 day average and the percentage of the component stocks that closed above that average. The longer term trend measures focus on the 30 week averages. Why 30 day and 30 week? Over my 40+ years of trading, I have found that these are the best trend indicators for market movement. I must admit it was Stan Weinstein’s classic book (see Weinstein’s book at right) that alerted me to the usefulness of the 30 week average. The reversal in the QQQQ’s 30 week average in 2000, and 2003 alerted me to get out of the market in 2000 and to get back in, in 2003. Check it out! As for the 30 day average–I have found it to be the most reliable indicator of the short term trend.
The current WPM is quite bullish. All indexes closed above their 30 week and 30 day averages. The weakest indicator is the Dow 30 stocks, where only 63% closed above their 30 day averages and 53% above their 30 week averages. Let me know what you think of the WPM and how often you think I should post it………………………
This is earnings season. Have you ever noticed how the media report earnings in such a way as to maximize volatility and emotional reactions? It all focuses on whether a company beats analysts’ expectations. So, some group polls the analysts that follow a stock and then highlight the average of their estimates. Now, consider the following hypothetical per share estimates from 5 analysts: (.25, .30, .20, .20, .30). The average is .25 per share. Now say the company reports .21 per share. The media would report that the company missed earnings estimates by 4 cents (.21 instead of the predicted average of .25) even though the company actually beat the estimates of two analysts (who predicted .20 each). So everyone sells and the stock dives, not because missing the estimate is so bad–the company made a profit–but because everyone fears that the other person will sell. And so the hysteria continues. If the media and financial community wanted to report earnings responsibly, they would report the range of the analyst estimates. In this example, they would have said that analysts expected anywhere from (.20-.30 per share) and that the actual earnings were within the predicted range. I think this would take a lot of the hype out of investing. (I suspect, however, that someone would report that the earnings fell at the bottom of the predicted range–and provide another excuse for selling.) Darvas was right when he said Wall St. was a big casino. …………………………………….
Here is a list of stocks from the IBD 100 that had triple digit earnings increases last quarter and look to me to be rockets: CNXS, BMHC, CPSI, LUFK, HANS, SNHY. (Also, AFFX, PTC and CTO have year-over-year growth in earnings of 100% or more.) This is a list worth researching…………………………………….
Gary–I lost your email and could not reply to you. I appreciate your inquiry into why I did not post Thursday’s report on time–just sleepy. Thanks for your feedback.
Send me your feedback at: silentknight@wishingwealthblog.com.
Please remember that the stock market is a risky place, especially now. I am not providing recommendations for you to follow. My goal is to share tools and methods that I have used over the past 40 years of trading, so that you may learn from them and adapt them to your trading style and needs. While I do my best, I do not guarantee the accuracy of any statistics computed or any resources linked to my blog. Please consult with your financial adviser and a mental health practitioner before you enter the stock market, and please do not take unaffordable risks in the current market environment. See the About section for more statements designed to protect you (and me) as you navigate this market. Past performance does not guarantee future results, but I would rather learn from a former winner than a loser.
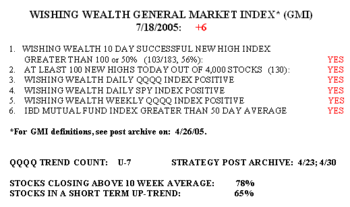 However, the 10 day new high index was weak. Only 103 (56%) of the 183 stocks that hit a new high 10 days ago closed higher today than they closed 10 days ago. Both Darvas and O’Neil have written that when breakouts to new highs begin to fail, the market may be topping. Only 28% of the Nasdaq 100 stocks rose today, 30% of the S&P 500 stocks and 17% of the Dow 30 stocks. On the other hand, there were 130 new highs and only 8 new lows today. We are in the 7th day of this up trend in the QQQQ. I am not worried yet, but I am watching my stocks more closely and not adding to positions.
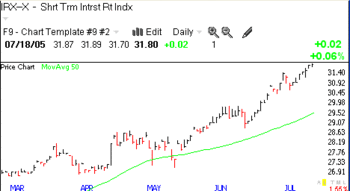 Look at this chart of the short term interest rate indicator. It just keep rising, suggesting that at least near term rates are headed higher. Here are some examples of interest rate related stocks that appeared in my scan today: MUA, MVF, MYD, MQT, NXZ, NPX, NPM, NPT, PMX, PMF. Most of these are bond funds. Why are they breaking down? Maybe some of you have some ideas about this pattern of declines?
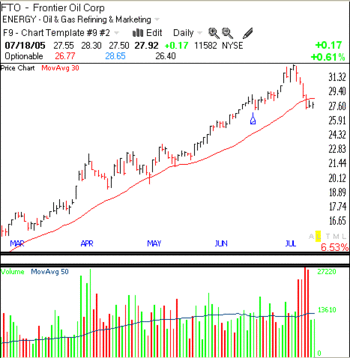 Other stocks with high volume declines include IMO, GI, IOC, SU, MRO. Is oil finally topping out or is this just a rest– caveat emptor!

