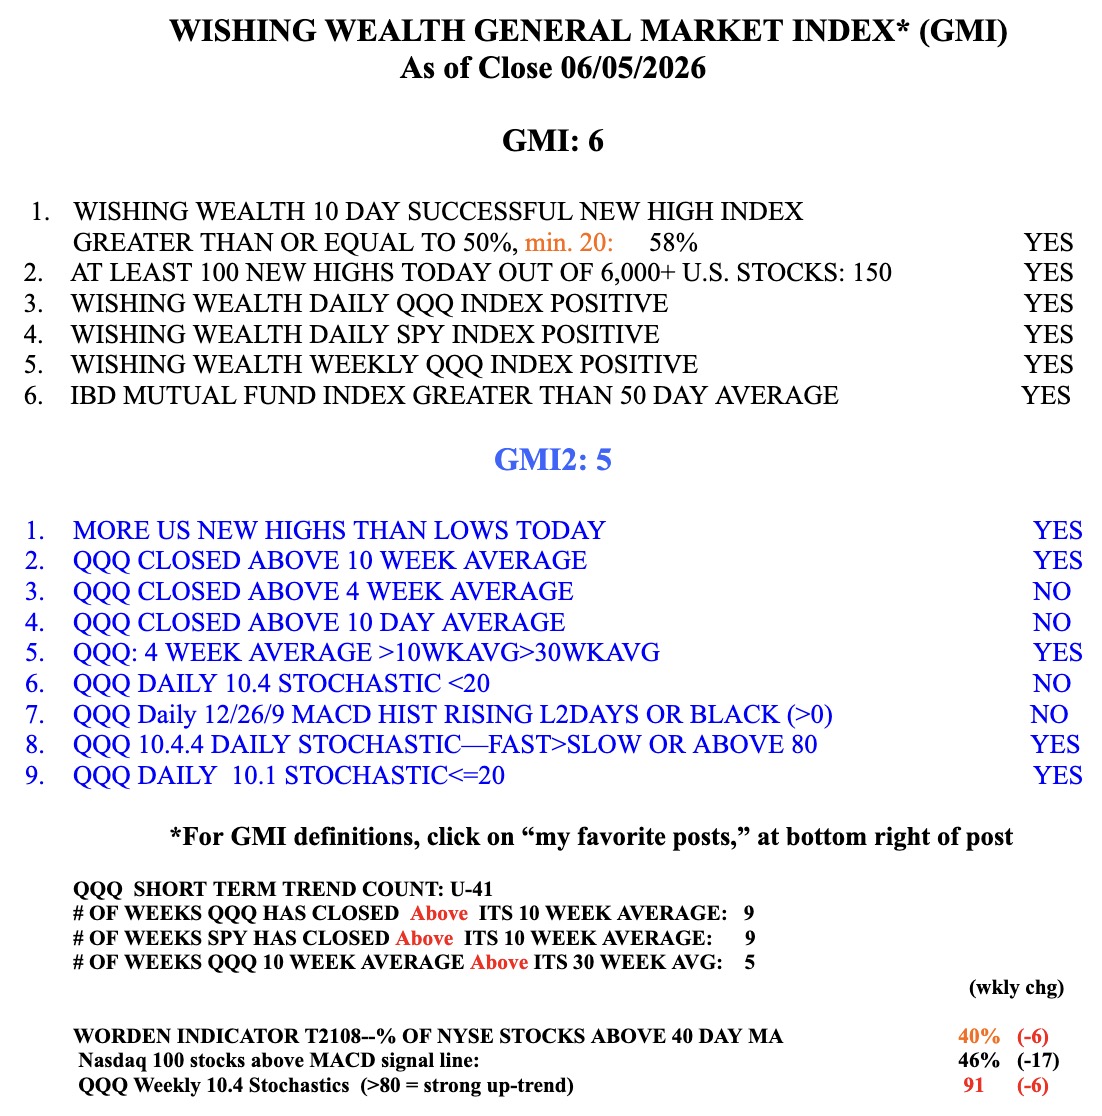
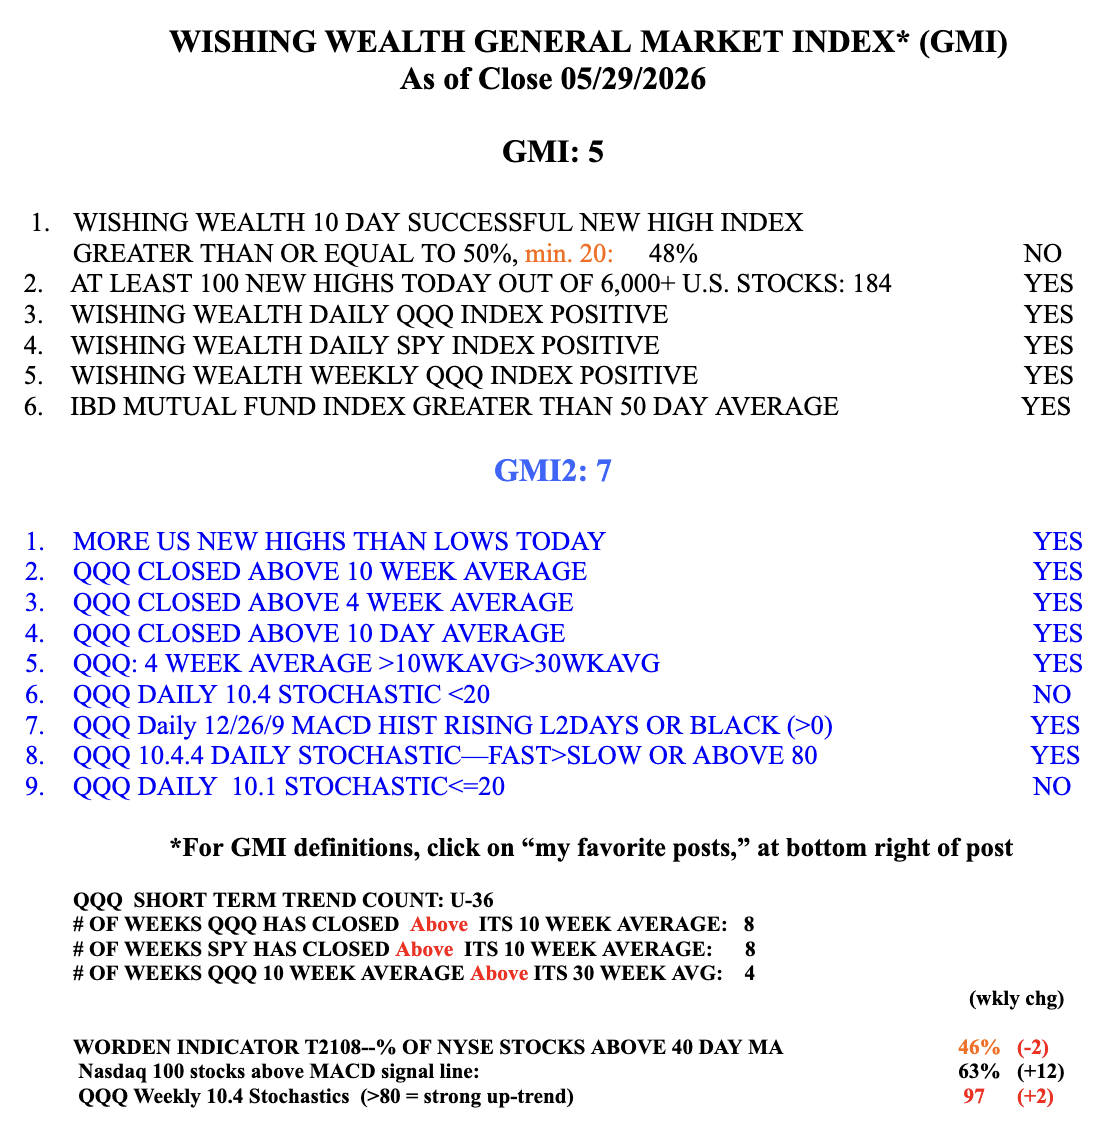
The GMI remains GREEN at 6.
Stock Market Technical Indicators & Analysis
The GMI remains GREEN at 6.
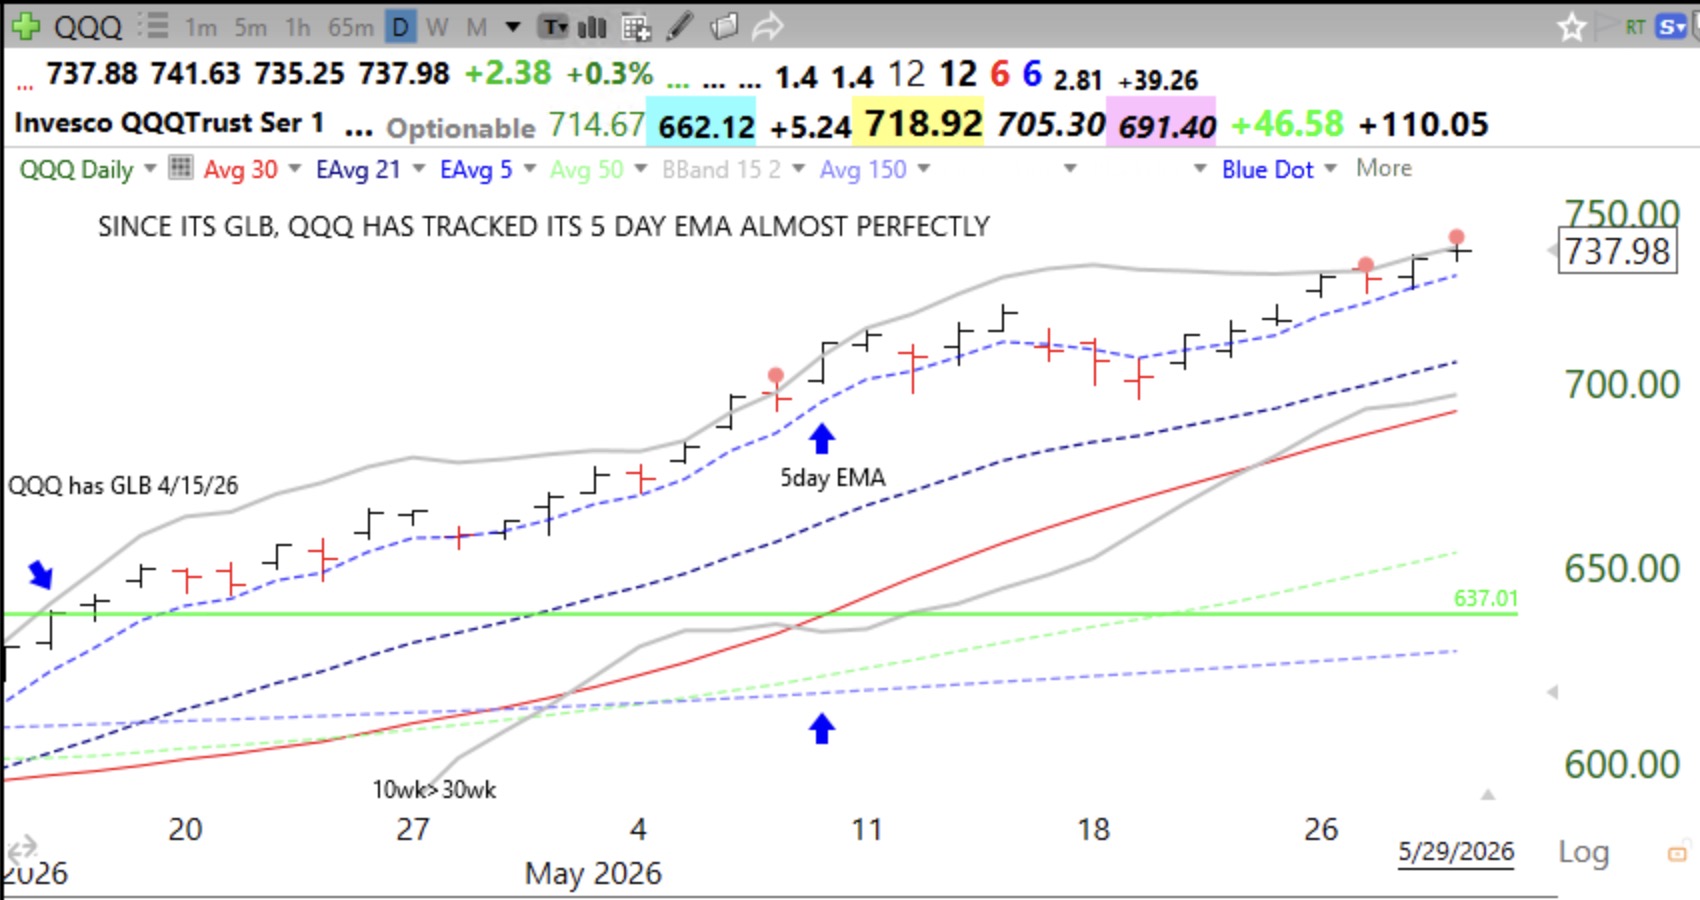
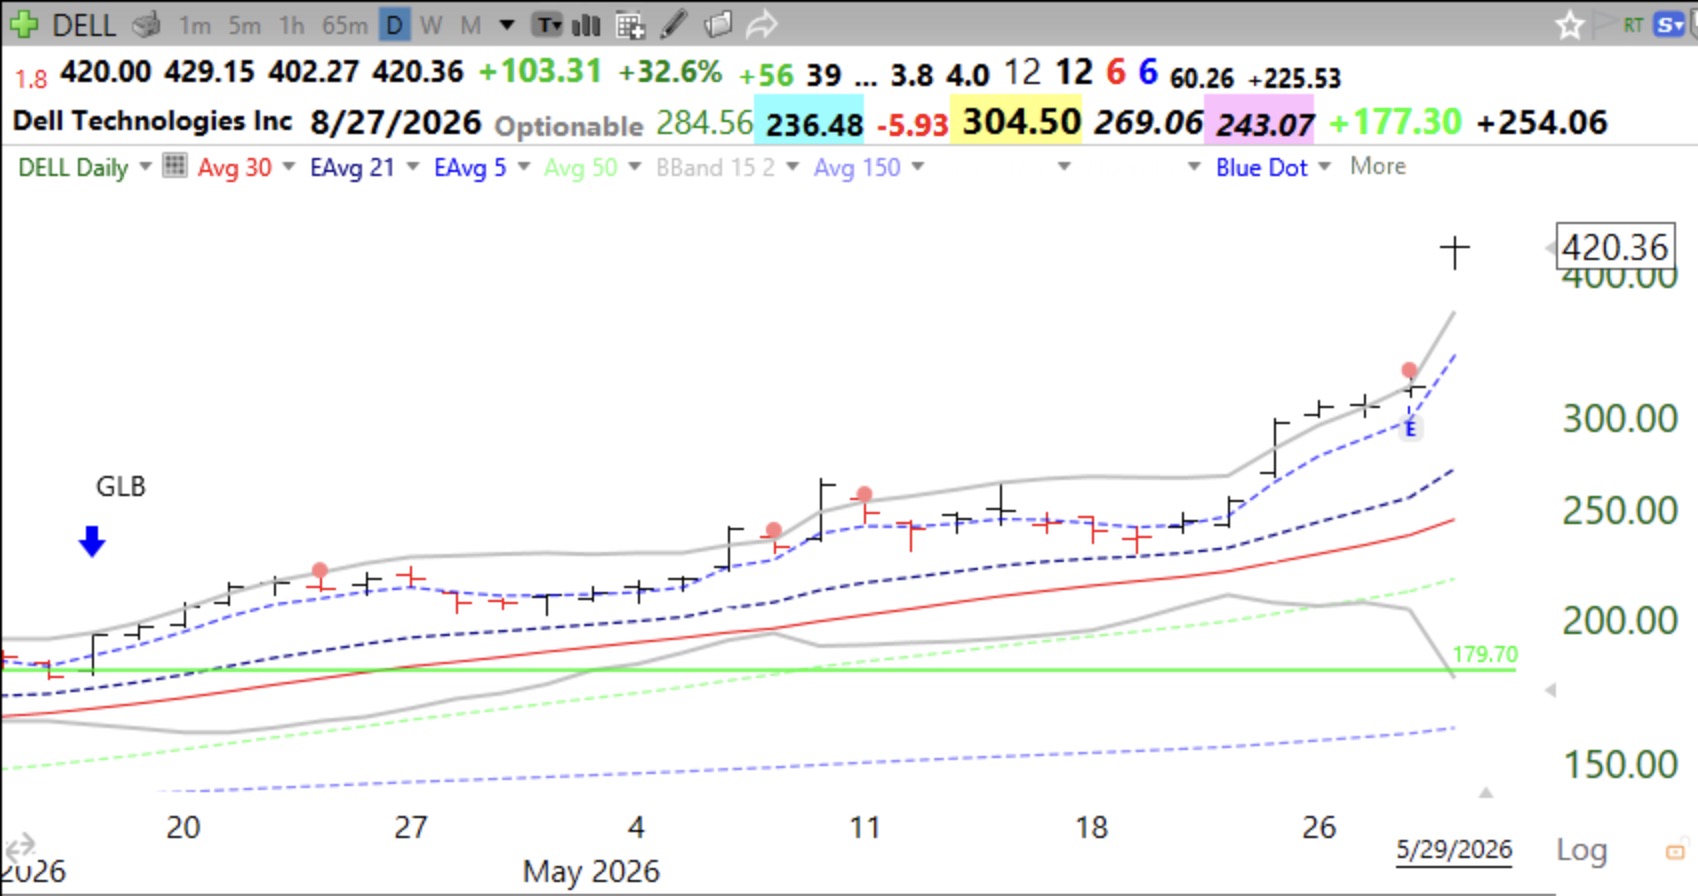
One can design steups for trading based on the 5 day EMA. The 5 day EMA> 21 day EMA > 30 day SMA and ? Look at this chart and create your rules. I may look for bounces up off of the rising 5DEMA. See these daily charts of QQQ and DELL.
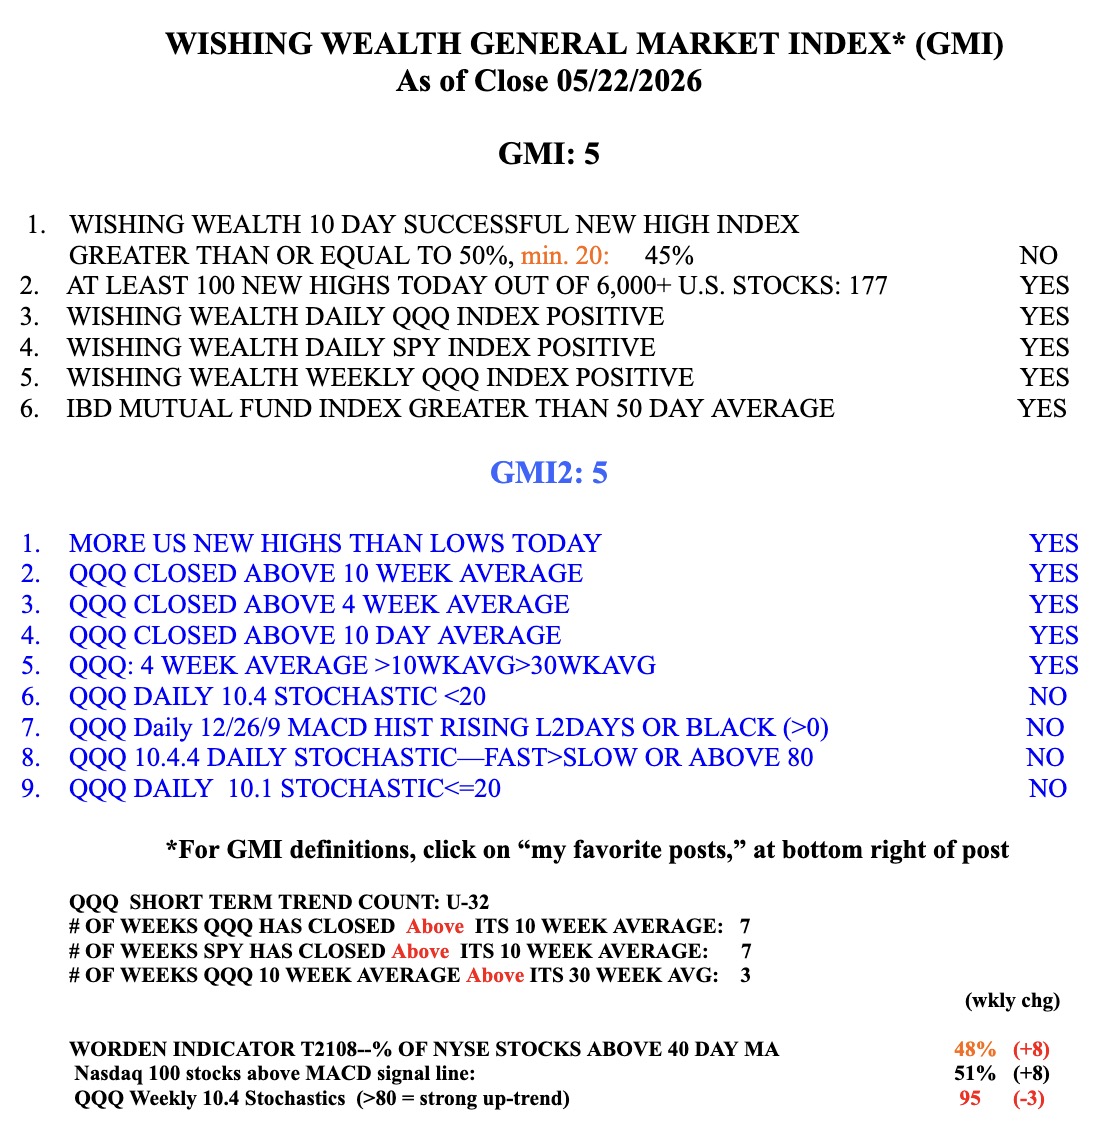
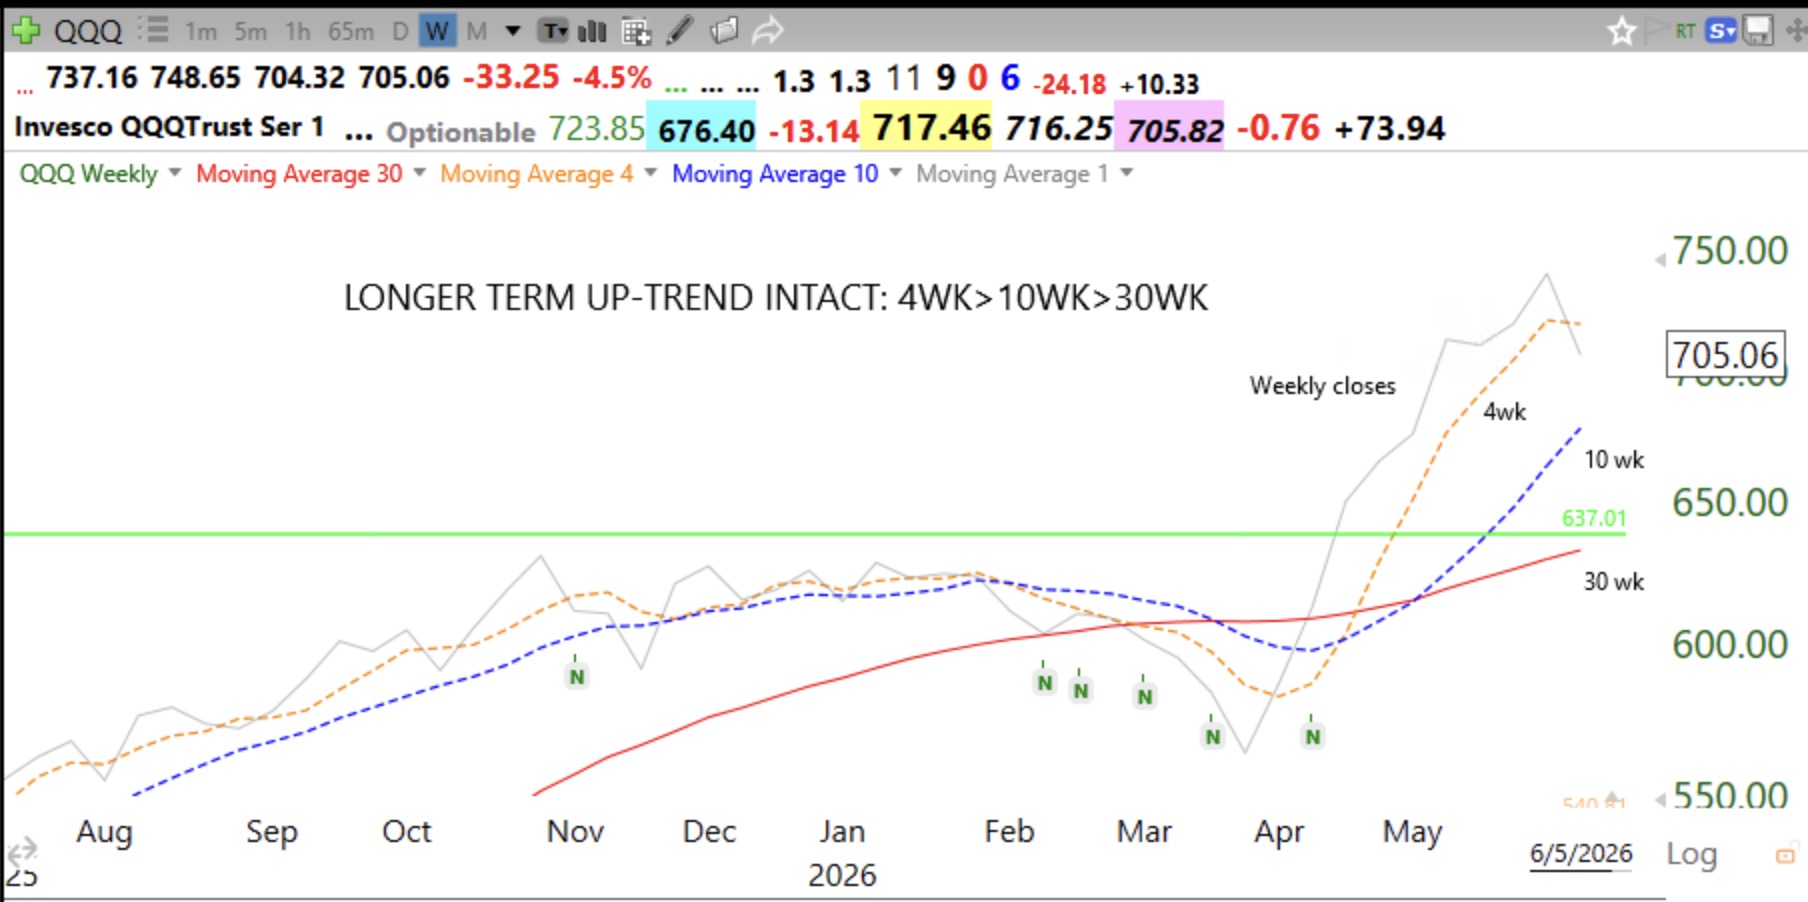
The GMI remains GREEN and is at 5 (of 6).
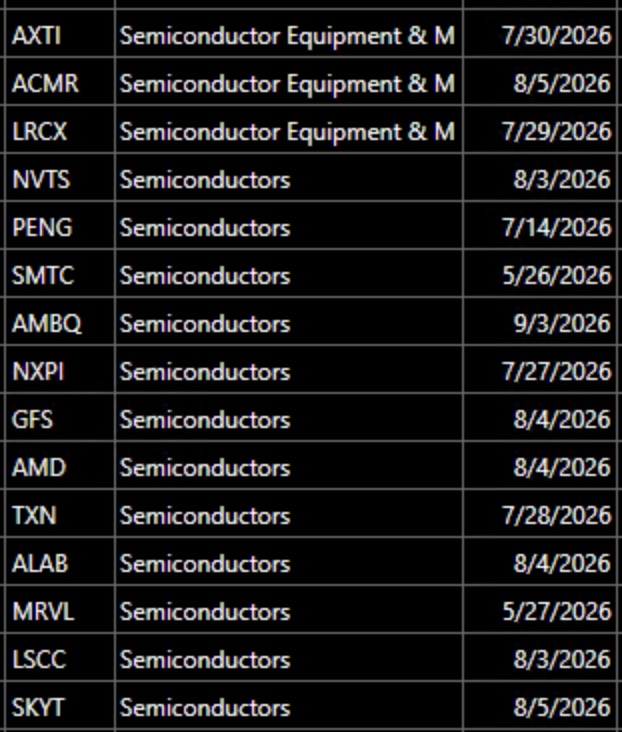
Theses 15 stocks traded at an ATH (all-time high) on Friday. Five had a GLB last week: NVTS, NXPI, GFS, ALAB, SKYT. Check them out and draw in their green lines according to the rules I specified at my recent presentation to the MoneyShow. Any that CLOSE below their green line, I would consider to be a failed GLB.
The GMI remains relatively strong, for now.