Blog post: Wish-Darvas scan finds 14 stocks to monitor Monday: $CASH $CAMT $MYRG $GM $HIBB $WSM + 8 others listed

GMI6/6
GMI-27/9
T210857%

This weekend I created a new scan column in TC2000 that puts together most of the characteristics of winning stocks that I have embraced over the years. Some were suggesetd by the great Nicolas Darvas. Most, I created based on my trading experience and reading the past 50+ years. This scan finds  stocks that meet the following criteria:

>$20, near all-time high, yellow band for 5+ weeks (see my 2012 TC2000 webinar link on my blog for the definition of yellow band stocks), reached a  new high within last 25 days, closed up today, closed up >80% from a year ago (Darvas liked +100%), bounced up off of exp 21 day or simple 30 day average today.

The 14 out of 6,081 US stocks that met these criteria as of Friday’s close appear below along with their projected next earnings dates. I copied these symbols into a watchlist to monitor on Monday with a column to show me whether Monday’s high is above Friday’s high, another sign of strength. Note that 6 of the 14 have a blue flag, indicating they came to my attention after appearing on an IBD or MarketSmith list in the recent past. I am not recommending these stocks and do not own any of them. They are listed for educational and research purposes only. Maybe some of these will turn out to be true market leaders. Remember, if I buy a stock after a bounce up off of one of these moving averages, I must sell immediately if it closes back below the average. The nice thing about this strategy is that it incorporates longer term and short term technical criteria. Before buying I check IBD or MarketSmith for strong fundamentals and projected earnings. I can run this scan every day near the close to look for possible winners.


Here are the daily, weekly and monthly charts of one of these stocks, CAMT,  as an example. Note the black and green dots showing oversold bounces on the daily chart.

The GMI is at 6 (of 6) and remains Green.


Market in strong up-trend; Beware the bearish media pundits; Gold’s “sudden” decline

GMI6/6
GMI-26/9
T210861%

All of my indicators remain positive. Most important, the QQQ has now closed back above its 10 week average price, after closing below it last week.   It is amazing to me how many of the media pundits are saying the market is too high when the SPY and DIA have just broken through their green line tops to all-time highs.   When a stock or index does this, it often is followed by a multi-month rise.   While a rise is not guaranteed, the index or stock should   stay above its green line level.   If it fails, like GLD (see example below) and AAPL did a while ago, then I would expect a major reversal of the-up trend.   The critical key is to not anticipate a change in trend, but to react after the signal is evident.   Such is the goal of the trend-follower. Take a look at these weekly Guppy charts of DIA and SPY.   They both have the RWB (red, white and blue) rocket pattern.

DIAguppy04122013

DISguppy04122013

Even the QQQ is in an RWB up-trend, although it is far below its green line top, around 119, reached in March, 2000. QQQguppy04122013

If these RWB patterns fail and the GMI flashes a sell signal, then I would reassess the market trend.   For now, I must assume that the up-trend will continue. I am therefore using TC2000 to scan for promising stocks. I ran my scan that looks for a daily new high that also has technical strength and recent good earnings increases. Here is the list of 7 stocks that came up based on Friday’s action.Newhighscan04122013 Interestingly, two are in the same sub-industry, SFLY and LNKD, which I own.   The blue flag on the left indicates that LNKD and WOR have shown up in one of my IBD stock watch-lists.   A glance at the monthly charts for these stocks shows me   that WY and SFLY are close to breaking though their green line tops to an all-time high.   The other five stocks have broken above their green line tops in the past few months.   Thus, all of these stocks are worthy of my subsequent review for possible purchase.   No one knows which of these stocks, if any, will rocket higher.   The key is to approach every purchase as if it will fail, and to have a ready exit strategy that will minimize losses. One successful trader I read has said that one could probably trade profitably by picking stocks by trial and error, as long as one quickly abandoned the losing positions with a small loss.   As he did, I use technical analysis instead of trial and error. The Wall Street maxim, cut your losses and let your profits run, is still sage advice. The GMI stats appear below.

GMI04122013

By the way, gold tumbled last week.   If you take a look at this monthly chart of the gold ETF, GLD, you will see that this decline should have come as no surprise.   GLD has been below its 30 week average (weekly chart not shown) and in a Weinstein Stage 4 decline since February and its green lie break-out last July has failed and GLD has established a new green line top. I trust that none of my students would have been holding GLD, thinking it was a bargain as it fell. I suggest that the time to buy a stock or ETF is when it first breaks above a green line top to an all-time high, a sign of major strength. That is how the great Nicolas Darvas made a fortune. You can find his book listed to the lower right of this site. It is the first book that I assign to my college students.

GLDgreenline04122013

By the way, the link to my free December TC2000 Houston webinar   appears to the right of this blog page and will provide you with an extensive introduction to my university class and trading strategies. I welcome your comments, please.

An excerpt from my trading diary from the 90’s; Market at critical juncture? IBD declares new up-trend; ASPS and QCOR

GMI3/6
GMI-23/9
T210834%

“It continually amuses me how people call into these radio commentators and ask them for their advice about when to buy and sell, when all have shown an inability to predict these major declines.   Each day these sages offer new advice and wipe the slate clean from their past failures.   Perhaps we need a system of rating their past performance for listeners–but then no one might survive such scrutiny!   So far, these persons are telling the public to hang on because the market always comes back, in the long run.   But as many have said, we are all dead in the long run.   Noah, how long can you tread water?

 I am pleased that I have been able to avoid this decline.   If you ignore all of the media and opinions and merely look at what the market is doing, you can easily see the trend of the moment.   All of this interpretation gets in the ways.   Just watch the averages (stocks, bonds, interest rates)   and their trend lines.

 By the way, we just passed the anniversary of   the inception of this diary.   Happy Anniversary!”                           (Written by Dr. Wish, July 1996)


I wrote the above as part of a trading diary that provides my observations on the market and life during the great tech bull market of the late   90’s.   In reviewing it this weekend I was struck by the difficulty I had as I struggled to learn how to trade.   Even though I multiplied my IRA many fold over this time period, it was a very difficult journey.   Don’t let anyone tell you it was so easy to make money in that great bull market–it was not, at least for me. I wrote in real-time about all of the psychological demons that sabotaged my effectiveness.   The sentiment in the quote above was a large part of the reason I chose to start teaching a university course on the market and this blog.   I saw so many adults lose their hard earned savings by listening to the “buy and hold” urgings of the media pundits.   I wrote the trading diary ultimately to teach my sons about the market, but like many offspring, they appear uninterested in learning from their dad’s experiences. One day I might publish this diary for others who might seek to benefit from my musings.   Any interest???

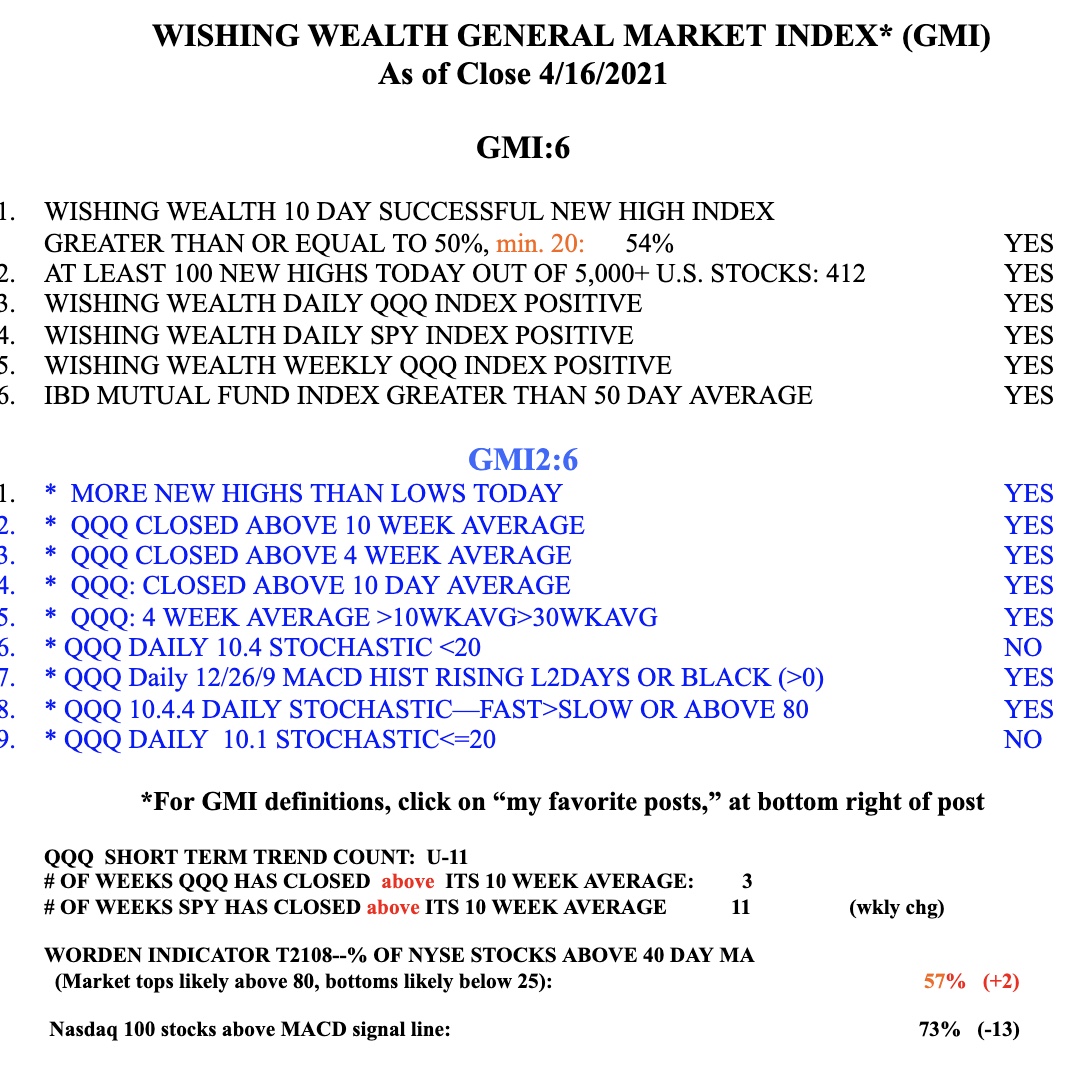
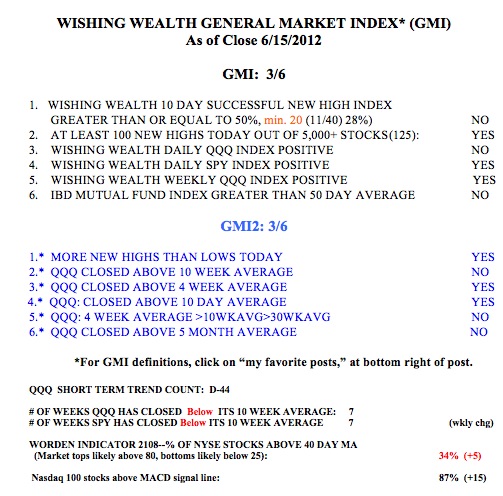
I believe we are at a critical   juncture in the market.   There are many signs of strength and given the fear and bearishness all around us, I would not be surprised to see Mr./Ms. Market rally.   Indeed, one more strong day will turn my QQQ short term trend indicator up, after 44 straight days of a down-trend.   And as of Monday, IBD has now declared a new market up-trend. I have already closed out my short positions.   Based on next week’s action I will start adding QLD or QID slowly, consistent with the prevailing trend. If an up-trend begins, I will not weigh in heavily until the 5th day.   Most new trends that last 5 days can go on considerably longer.

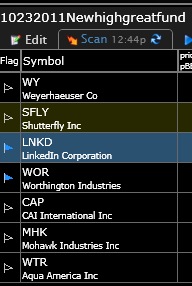
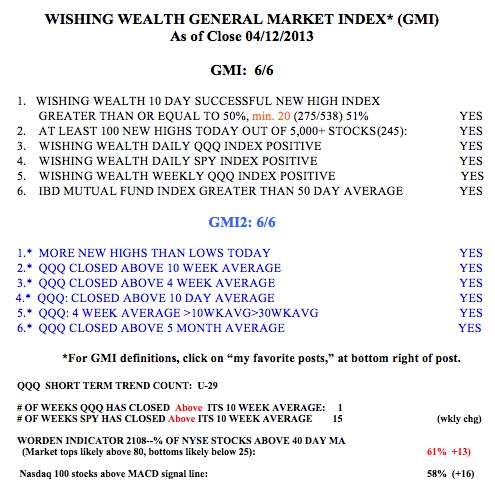
87% of the Nasdaq 100 stocks closed Friday with their MACD above its signal line, a sign of short term strength. The T2108 indicator is at 39%, in neutral territory. There were 125 new 52 week highs and only 84 new lows on Friday, another sign of strength. If we have a strong day on Monday, the GMI will be back above 3 for the first time since May 2.   Two consecutive days with the GMI above 3 would turn the GMI signal to buy. One reason we might see a rally is the coming end of the second quarter and the anticipation for the release of earnings. End of quarter window dressing is suspected at the end of each quarter as mutual funds are believed to buy up the recent winners and “dress-up” their portfolios for their quarterly reports to investors. (The quarterly reports conveniently do not specify when and at what price portfolio holdings were acquired.) I will therefore focus on the strongest stocks if the market strengthens.

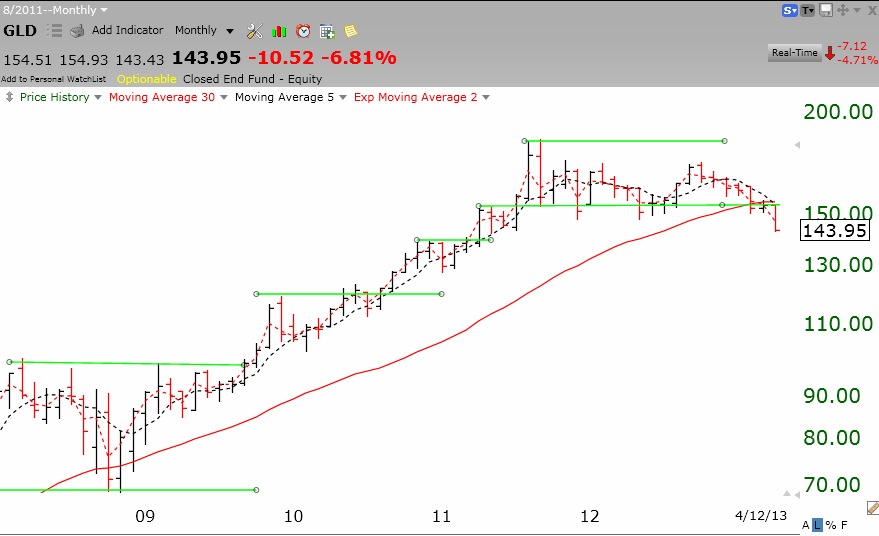
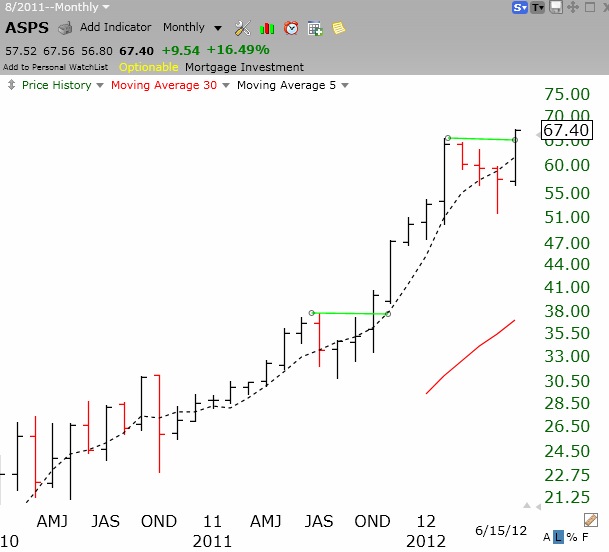
Speaking of strong stocks, I have been writing about ASPS for some time.   Last week it broke to a new all-time high, as this monthly chart illustrates. (I have a position in ASPS.)

The green lines show the tops of multi-month bases.   ASPS has just broken above a 4 month base.   People often tell me that they want a stock that will climb higher but will not buy a stock that is at an all-time high!   They really should look at monthly charts of great stocks.   How many times do they hit all-time highs on the way up?   The key to findings winners is to look on the new high list each day as a starting point.   Then look at their monthly, weekly and daily chart patterns to weed out the weaker stocks.   Then go to IBD and do a stock check-up.   At least this is what I teach my students to do.   And then, by all means, after purchase, designate an exact   price to sell out if the stock fails to act as anticipated. By the way, ASPS also came up independently in my TC 2000 scan modeled after the trading strategy of the great Nicolas Darvas. His book, to the lower right, is the first one I assign to my students. It is a great introduction to the stock market and the many misleading myths about the market.

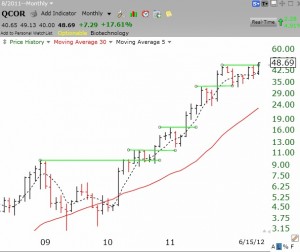
QCOR also came up in my Darvas scan, It has a similar break above the top of a multi-month base, as this monthly chart illustrates.   If the market continues to rise, I am watching both stocks closely for a possible entry or to add more. (Click on charts to enlarge.)

Other stocks that came up in my Darvas Scan are:   ULTA and SIX and ALXN.