I am writing this post primarily to teach my students how I search for potential rocket stocks–stocks that have been launched and appear headed towards new peaks. As I said in class this week, it makes the most sense to buy stocks that have the best fundamentals and technicals. This strategy has been advocated both by Nicolas Darvas and William O’Neil in their extraordinary books (listed at lower right of this blog). Darvas, made a fortune trading in growth stocks in the late 19050’s and said that he liked to buy stocks that were trading at all-time highs and that had already doubled in the past year. So, I am going to show you how I use the great TC2007 stock charting and analysis program to find potential rocket stocks that I research further before buying.
First of all, I am interested in buying stocks again, now that the GMI has risen to 6. Remember, I want to trade consistent with the general market trend-I must not fight the tide. I only have an edge buying stocks when the market is in an up-trend, as shown by the GMI being at least 3. Both Darvas and O’Neil stressed the importance of trading consistent with the market’s trend–70-80% of stocks follow the general market’s direction. Both tend to sit out the market in cash when the market’s trend is down. One of the hardest things to do is to stay away from the market (at least from the long side) when the trend is down.
So, with the trend now up, I used TC2007 to sort my watch list (called stock universe) of 4,000 actively traded stocks above $5, by whether the stock traded at a new 52 week high on Friday. I found that there were 222 new highs in my stock universe on Friday. Next, I needed to find how many of these stocks were trading at or near their their all-time highs, defined as the highest price they have traded at in the past 10 years. To do this, I set my chart to show monthly prices and space barred through each stock. For each stock that was trading at or within a few $$ of the highest price it had traded at during the past 10 years, I flagged the stock by pressing the “F” key . I then created a new watch list and copied the 32 flagged symbols into it. I next unflagged the stocks in this new watch list and selected my watch list tab that includes selected fundamental and technical information, including quarterly and yearly earnings changes, PE, last closing price divided by close a year ago, % change in revenue last quarter, and P/S (price to sales) ratio (see table below).
As I looked at this information for the 32 stocks, I found the following. A little more than one half (56%) of these stocks had an earnings change during the most recent quarter of +35% or more, with 22% having had at least triple digit earnings increases. In addition, 38% had losses the prior quarter or blank fields because they had no prior earnings with which to make a comparison. The PE ratios ran from 0 (no earnings) to 128, with 53% having a PE above 20. One half of these 32 stocks were trading at twice the price they were trading a year ago. 38% had revenue (sales) increases the last quarter of at least 12%. P/S (price to sales ratio) varied from 0 to 40 with half being less than 2.
I next decided to re-flag (press “F” key) each stock that had a most recent quarterly earnings increase of at least 30% OR revenue growth of at least 12%. I then copied the flagged symbols into a new watch list which became my final watch list of stocks at all-time highs with good recent quarterly earnings or revenue increases. The final watch list of 22 stocks appears in the table below, with stocks sorted by their most recent quarter’s % change in earnings. I then unflagged the symbols in this final watchlist (right click in the box to the left of a symbol and choose unflag all symbols in watch list) , and went to another watch list I maintain that contains many of the stocks that have appeared in the IBD 100 lists or the IBD New America column during the past year, and flagged all of the symbols in that watchlist. A list of the New America stocks over the past few months typically is published in the New America section of IBD each Friday and the list of the IBD 100 stocks is updated each weekend and is available in their website (investors.com). Thus, when I returned to my new all-time high watch list, I knew that any flagged symbol was a stock that had been an IBD 100 or New America stock, indicating that the IBD analysts thought it was a strong or promising company. Interestingly, more than two thirds (15/22, 68%–CREE was added to my IBD 100 list today, after I produced this table.) of the stocks that met my stringent criteria had been independently selected as an IBD 100 or New America stock! (This is why I can often begin my search for great stocks by going to my lists of the IBD 100 and New America stocks.) 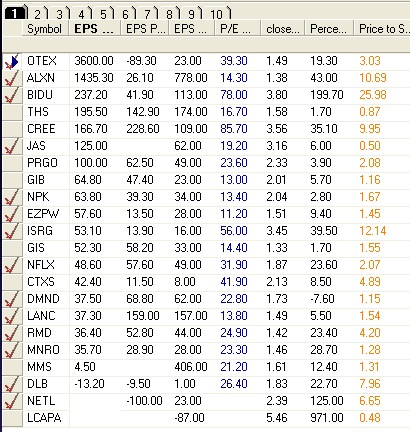
Taking a look at the surviving 22 stocks in this table (click on table to enlarge) I can make some additional observations about these stocks. For all of the stocks with earnings increases of at least +35.7% (column 2) but one (ISRG), their PE (column 5) is less than their earnings % increase for the most recent quarter. This means that their PEG (PE to growth ratio) was less than 1, suggesting that the stock may be in a favorable price range to people who use this statistic as an indication of a stock’s value. For example, CREE had a recent quarterly earnings increase of +166% and a PE of 86, giving a PEG of .52 (86/166). The PE is high, but the earnings growth is even higher. Even ISRG has a PEG close to 1 (56/53). (The table is sorted by column 2, most recent quarter’s earnings change.) Note also that P/S (column 8, the price to sales ratio, analogous to the PE, but using sales instead of earnings) for half of these stocks is less than 2, another indicator of value, to some. Some technicians believe that sales are a better measure of a company’s performance than earnings, which can be more erratic. Where there is no value in the table, it means that there were no earnings with which to make a comparison. Note that there are a few companies that have relatively high earnings and revenue increases (ALXN, BIDU, CREE, ISRG, NFLX). These stocks might be especially good candidates for additional analysis. (Column 7 shows % change in revenue in the most recent quarter. ) Other characteristics that I would look at next is trends in the volume of shares traded, recent news, next earnings dates, and the types of fundamental and technical information provided in the IBD Stock Checkup screen.
While it took some time to write (and read) these instructions, be assured that once you get the feel for TC2007 you will find that you can do this analysis in a few minutes each night…….
Now, the GMI and GMI-R are back to their maximum levels. 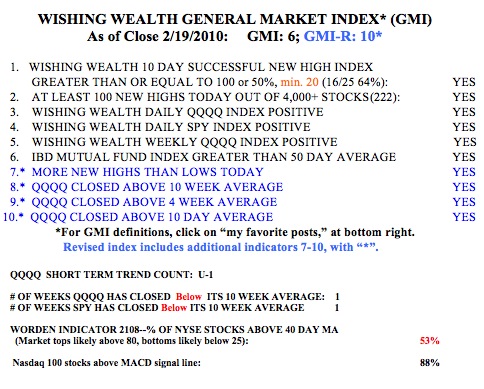 My short term trend count for the QQQ is now U-1, the first day of the new short term up-trend. How long will it last? Nobody knows! So I buy and always keep an eye on the exits. The QQQQ and SPY have now closed above their 10 week averages and 88% of the Nasdaq 100 stocks now have their MACD above their signal line. The Worden T2108 indicator is in a neutral zone, at 53%. I own and am watching many of the stocks posted on the right of this blog, in the Stocks I’m Watching column. I wade in slowly to my positions. One rule I like, is to enter every trade as if it might fail so that I have an exit plan ready and am not unprepared if the stock goes against me. The key to profitable trading is to have many small losses and a few large gains.
I would like to first thank you for taking the time for sharing your stock market analysis and thoughts. I have read your recent post and many of your earlier ones and a couple questions have arose.
If your indicators turn positive and you are on the side lines, would you buy the Q’s or QLD at the open or watch indicators such as Bollinger Bands and pick a spot. In one post you stated that you should buy when the stock price is near the lower band to purchase. If you are watching stocks near their 52 week high, nearly all indicators should be at the highs. How would you decide what is a good price to enter?
One other question on July 20, 2009. You stated,”I get out of the market when the 30 week averages turn down and back in when they turn up. I know this seems simplistic and naive, But it Works!” Did you mean when the price touches the 30 week or actually turns? I know you put more weight on your GMI and GMI-R, but if the three are in contradiction of each other which is most important on deciding if it is time to exit or enter the market?
Again, thank you for taking the time to read my questions and for the site.
Dr. Wish,
Thanks for sharing another insightful post. I too speculate among all-time highs. A challenge I encounter at times is that historical stock price data is inconsistent. Take CREE for instance, as you’ve mentioned it in your post. According to Finviz and evidently, your data provider, CREE is currently at an all-time high (or at least a 10 year high); however, according to the NASDAQ’s data or Yahoo Finance, CREE currently sits almost $30 below it’s all time high from the year 2000. CREE doesn’t pay a dividend so the adjusted stock price is not affected.
My question is this: does it matter whether a stock is at an all-time high, or even a 10-year high, or is it only important that the stock is in a strong up-trend and at a multi-year high?
-Ace
(link to NASDAQ chart: http://tinyurl.com/ylg8co3 )
I was going through your articles and have same queries as someone else mentioned above. Can you please reply to above queries.
Thank you for all the good articles.
Regards
Dhabud
What do you want to know?
The article calls for using TC2007. I think it can be done with today’s TC2000 ver 19 or 20 (in beta). If you agree please update the title. If not, what does 2007 provide that ver 20 does not?