Stock Market Technical Indicators & Analysis
In my presentation to the Boston IBD Meetup on 5/21, I described my Blue Dot setup. Here is a list of 5 stocks that met that setup on Friday. They are worth investigating. No one knows if any of them will be successful. It often depends on the market’s action. But if I I bought one of these, I would immediately place a sell stop below the low of the bounce. The Blue Dot setup finds strong stocks that recently reached an ATH and just bounced from being oversold. Below are the 5. The last column shows each close Friday divided by its close 250 days ago. DUOL has almost tripled and LRN has more than doubled. I described how I program the blue dot setup in TC2000 in a recent post.

PM and VRNA are examples of stocks that performed beautifully after a blue dot.The blue dot occurred 6 days after PM had reached an ATH. Note PM also bounced off of its lower 15.2 daily BB, a confirming bullish indicator. VRNA had a similar pattern.


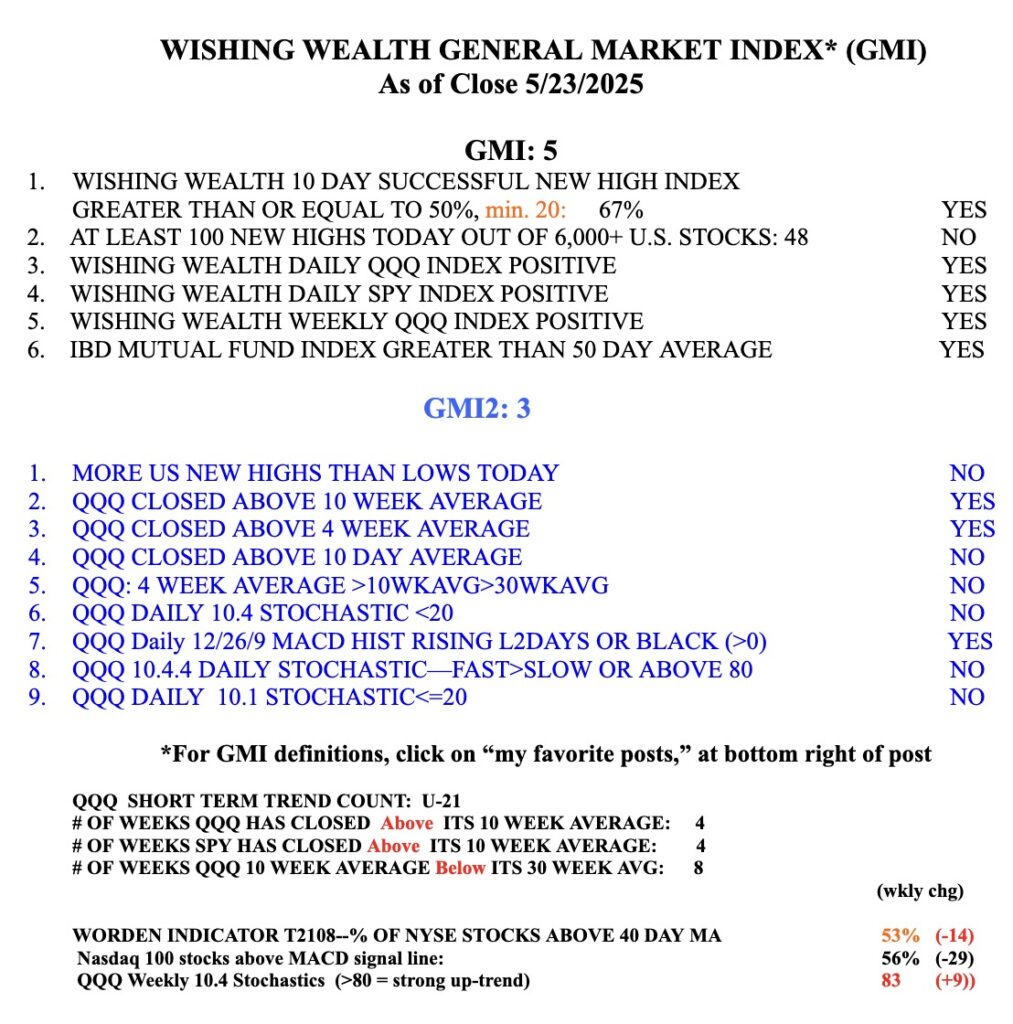
The GMi remains Green at 5 (of 6). So far the up-trend is holding.
I am concerned that there were more US stock new lows than highs on Friday. In addition, SPY closed below its declining 30 week average. This could be a deepening Stage 4 down-trend, especially if it cannot close this week above it. IWM and DIA look even weaker. However, QQQ closed above its flat 30 week average. So which index is the leader? I think this week’s action should tell us. Meanwhile, I own a little GLD and IBIT (GLB last week). I will exit quickly if weakness materializes. GLD has been nicely tracking my blue dot bounces, see daily chart. I explained my Blue Dot of Happiness indicator in my presentation last week to the Boston IBD meetup. You may sign up for the wait list for my future Masterclass with TraderLion here.

The GMI=5 (of 6) but look at how my most sensitive components in the GMI2 are weakening.