Blog Post: Day 4 of $QQQ short term up-trend; 124 US new highs, 7 lows and 61 at ATH; see list of 10 stocks that doubled from a year ago and reached an ATH last Friday

GMI5/6
GMI-27/9
T210859%

These stocks are at least 2x their closing price a year ago, as shown in the last column. VRT is 4.1x its price a year ago. Nicolas Darvas and David Ryan liked to buy stocks that have already doubled in price. A stock that has already doubled is likely to be capable of going much higher. As with people, a stock’s past behavior can suggest its future behavior. Look at the GLB tracker table on this site to see evidence that stocks that break out to an ATH can move higher.

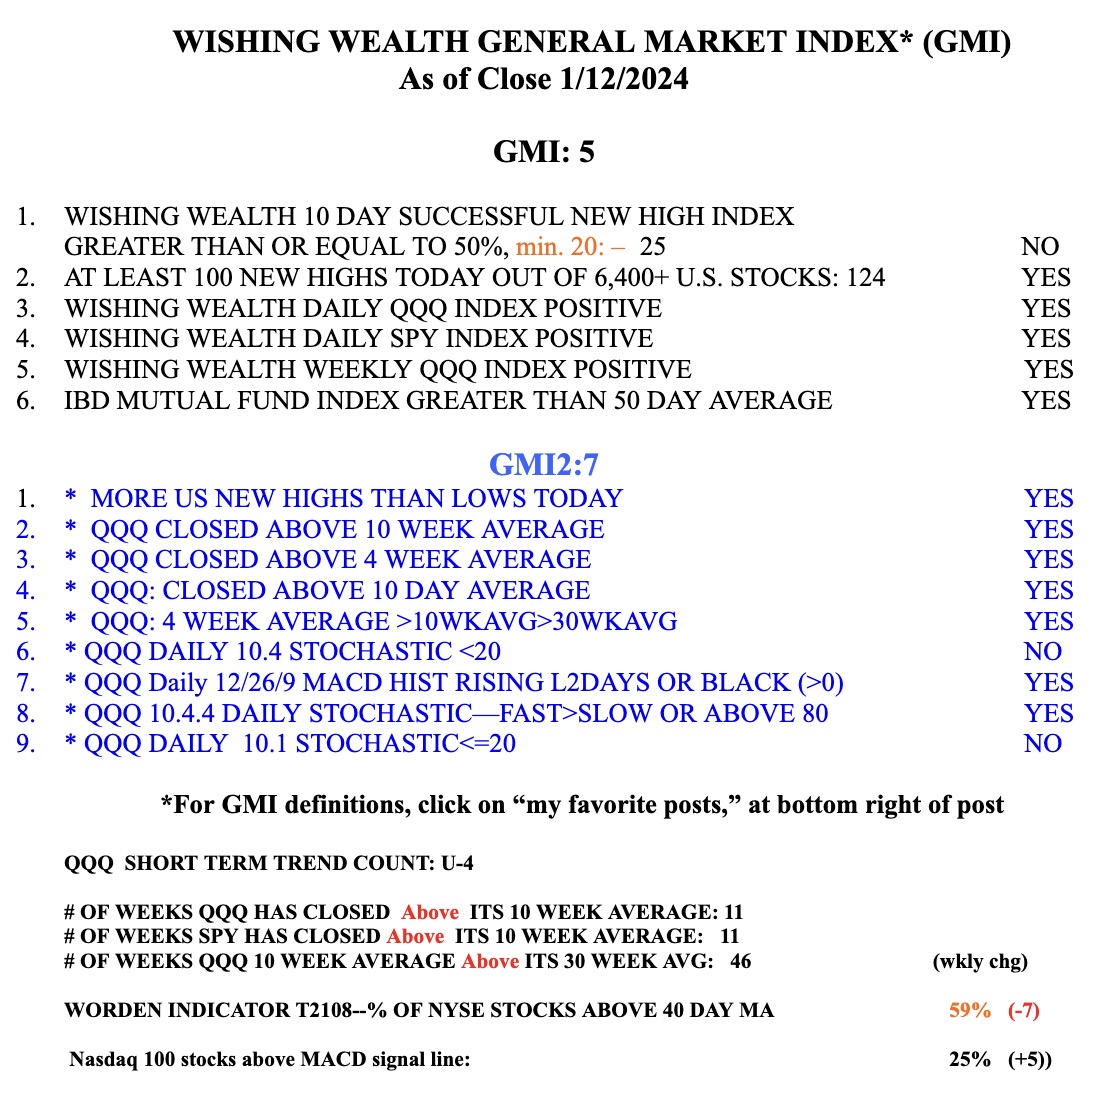
The GMI is Green and is at 5 (of 6). The GMI measures the longer term market trend. My separate QQQ short term trend indicator is also rising and is at day 4 (U-4).  The market often rises when earrings are released. That means the rest of January could be strong. But I prefer to react primarily to what is currently happening rather than to anticipate future market behavior. 79% of the Nasdaq 100 stocks closed Friday above their critical 50 day averages. I own some TQQQ.

Blog Post: Day 1 of new $QQQ short term down-trend; But 10 growth stocks did reach an ATH, see list; Of note, $JPM reached an ATH last week but closed just below its green line peak of $172.96

GMI3/6
GMI-24/9
T210866%

Stocks on my recent IBD/MS watchlists, sorted by last column, close /close 250 days ago. KGS was a recent IPO in 6/23.

The GMI, at 3,  still signifies a longer term up-trend. However, within this up-trend, QQQ has begun a short term down-trend. About 40% of these short term down-trends end within 5 days. If QQQ’s short term down-trend persists I may gradually accumulate some SQQQ.

Blog Post: Happy New Year! 10:30 weekly charts shows $QQQ, $SPY and $DIA remain in a Stage 2 up-trend, see chart for $QQQ; GMI remains Green and is at 6 (of 6)

GMI6/6
GMI-27/9
T210875%

As long as the index is rising above its 30 week average (red line) and the 10 week average (dotted line) is above the 30 week average, then the index remains in an up-trend. I do not try to predict, only to determine the market’s current trend. The gray solid line is the weekly close.