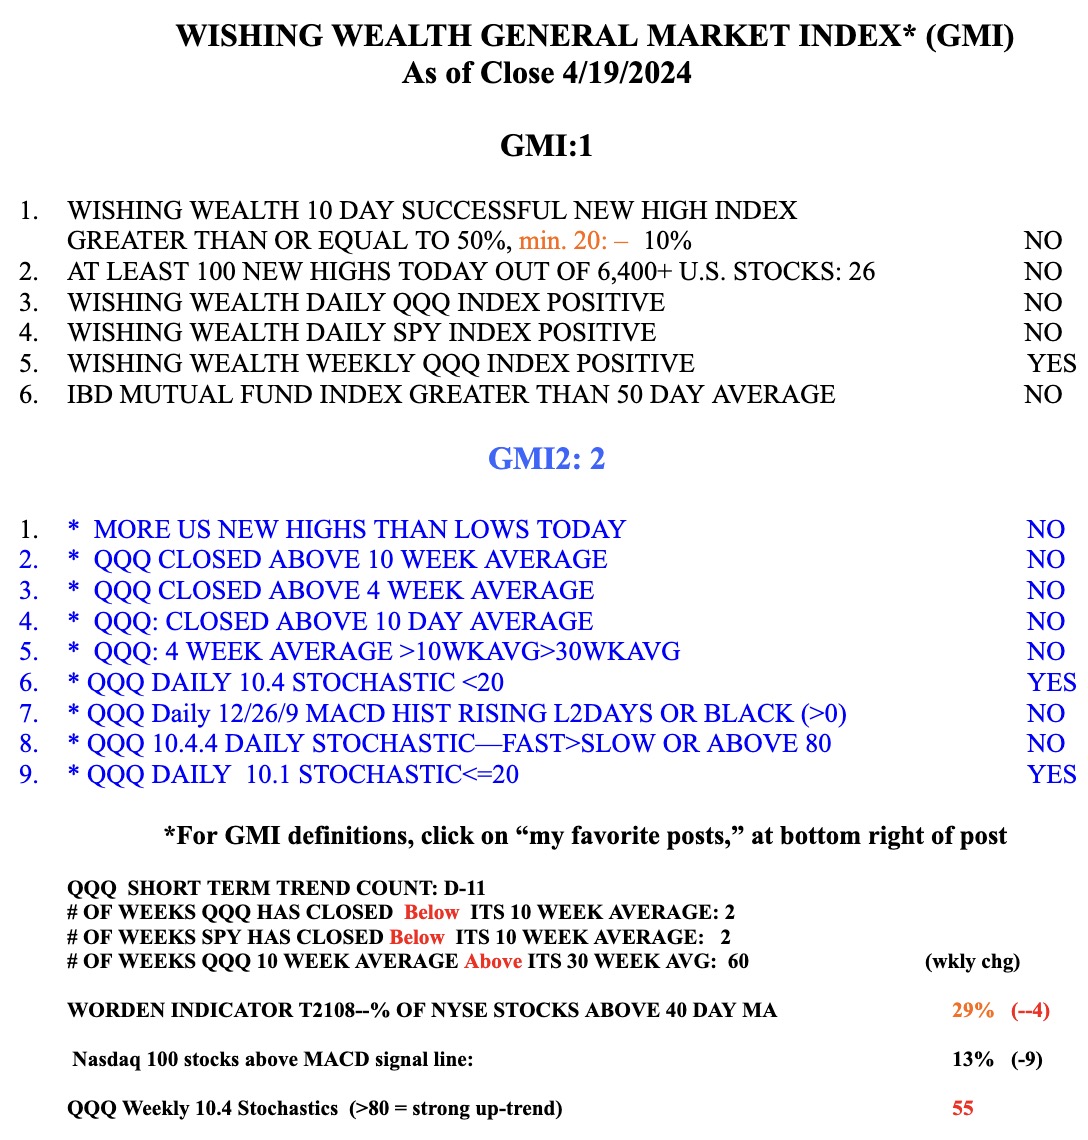
I recently discovered that the weekly 10.4 stochastic is a great indicator for an advancing market or stock. I am now recording the value in the last line of my GMI table, see below. Look at this weekly chart of QQQ. Note that the strong advancing market typically has a weekly 10.4 stochastic >=80 for many weeks in a row. This stochastic basically shows whether a stock is currently near the top of its range over the past 10 weeks. A daily stochastic with a value >80 is typically considered to be a sign of being overbought. But for a weekly time period it tells me that the stock or index is currently close to the top of tis 10 week price range. Isn’t that what we want to see in advancing market indexes or individual stocks? QQQ’s current 10.4 weekly stochastic is now=55, indicating to me the end of the recent multi-week advance. Most of my scans for strong stocks now require that the stock have a weekl y10.4 stochastic>80 for 5 or more weeks in a row. That is a strong rising stock. Here are two examples. Try it out.