I have found that if the a new QQQ short term up-trend lasts 5 days, it often will continue for more days. I am very slowly wading into this up-trend with a small purchase of QLD, the leveraged bullish ETF that is designed to rise (or fall) twice as much as the QQQ. If the up-trend continues, I will add to my position. If it fails, I will quickly exit. I know the longer term trend remains down, but the shorter term trend, by definition, turns up before the longer term trend. I remain in money market funds in my university pension.
Month: September 2011
QQQ short term up-trend survives–for now
My indicators remain unchanged. Monday was 3rd day of new QQQ short term up-trend. Let’s see if it can survive 5 days.
100% cash; S&P 500 in Weinstein Stage 4 decline
I was tempted to buy some longs recently and paid the price. I am now back to 100% cash. With the GMI at 1, it makes no sense for me to be buying or holding stocks. 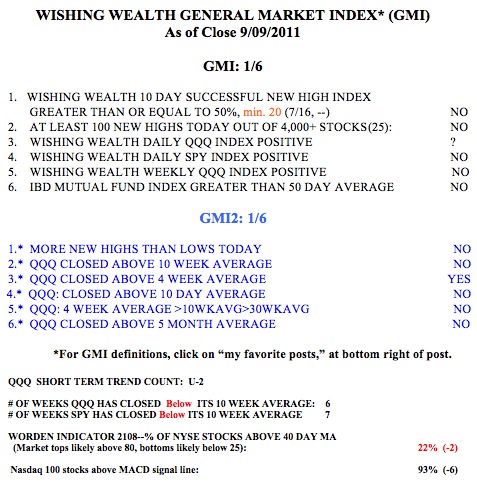 When the market turns up, there is plenty of time to go long and profit. The QQQ short term up-trend is in its 2nd day but another weak day on Monday would begin a new short term down-trend. It is very difficult to have the discipline to stay out of the market, but a few losses quickly gets me back on track. If I wanted to trade actively, I would be shorting or buying inverse ETF’s that go up as their underlying basket of stocks declines. Note that the QQQ has closed below its 10 week average for six weeks. The SPY, which is weaker because it contains financial stocks, has done so for seven weeks. The Worden T2108 Indicator is at 22%, in a neutral range, but close to the level where bottoms have occurred. On August 8, T2108 bottomed at 7%. It will be interesting to see if the market reaches that extreme weak level again.
This weekly chart of the S&P500 Index (click on chart to enlarge) shows that index to be in a Weinstein Stage 4 decline. 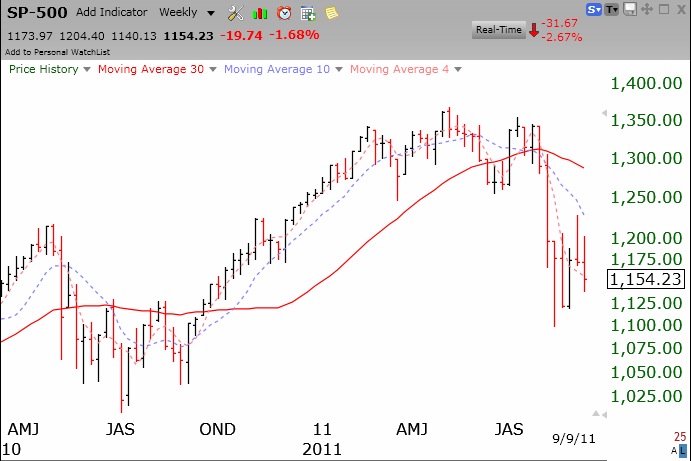 Note that the 4wk average (red dotted line) is below the 10 wk average (blue dotted line) which is below the 30 wk average (red line). This pattern is a sign to me of a major down-trend. We will know a new up-trend has begun when we get back to a pattern with the 4wk>10wk>30wk, as occurred last October at the beginning of that multi-month rally. The current decline looks more severe than the consolidation that occurred last year, because the 30 week average (red line) is now declining. A declining 30 week average was one of the patterns that alerted me to get out of the market in 2000, and again in 2008. No one knows when this decline (or any decline) will end. Better to be safely in cash than to try to guess the bottom. The GMI-2 will increase as the moving averages I monitor turn up and will alert me to a probable change in the primary trend of the market.