38th day of QQQ short term down-trend; Gold up against resistance

GMI3/6
GMI-23/9
T210825%

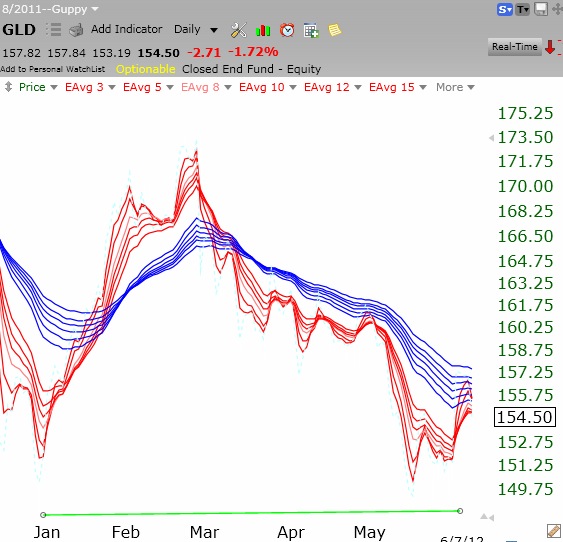
The daily Guppy chart (GMMA) shows that the gold ETF has been in a down-trend.   The short-term averages (red) are up against the longer term averages (blue).   It remains to be seen whether GLD can break through this resistance around 157-158.   The GMMA is composed of 12 exponential moving averages:   3,5,8,10,12,15 and 30,35,40,45,50,60.

37th day of QQQ short term down-trend; Guppy chart reveals S&P 500 down-trend

GMI2/6
GMI-23/9
T210826%

Yes, the QQQ remains in a short term down-trend.   Only time will tell if this rebound is a real end to the correction or just a bear trap.   Typically, down-trends don’t end so suddenly, and without panic.   But if the GMI returns to 4 or greater for two days, I will go long again.   The important thing is to wait for a definitive signal of a change in trend. IBD still calls the market in a correction.

The daily Guppy chart of the SPY shown below shows that the S&P 500 stocks remain in a solid down-trend.   Note that all of the short term averages (red) are well below the declining longer term averages (blue). Compare this pattern to that in the prior up-trend.   The fact that we are still in a down-trend should be very obvious.   When the red lines are back above the rising blue lines, it pays to be long and fully invested.