5th day of $QQQ short term down-trend; $QQQ closes below 10 week average; $AAPL on precipice

GMI1/6
GMI-21/9
T210823%

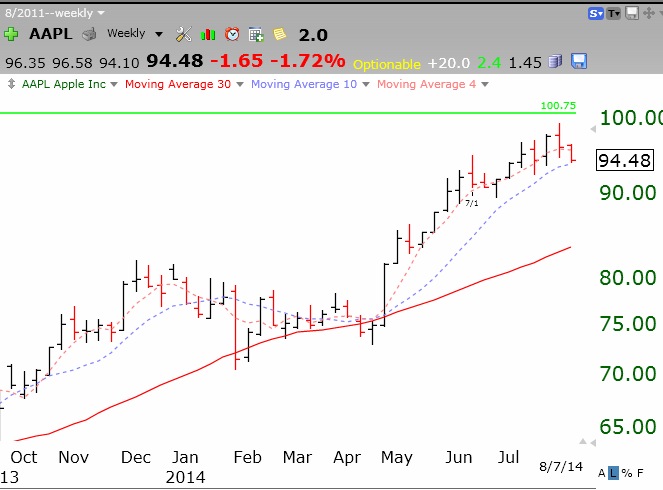
With the new short term down-trend reaching its 5th day on Thursday, I am slowly adding to my positions in the inverse 3X ETF’s SQQQ and SDOW. With the QQQ now below its 10 week average, my ability to make money trading on the long side is slim. This market looks like it wants to go down. AAPL is sitting on its 10 week average (blue dotted line) and a close below it would be a reason for me not to hold it. Click on chart to enlarge.

AAPLwkly08072014

3rd day of $QQQ short term down-trend; IBD: correction here; Small caps ($IWM) in trouble

GMI1/6
GMI-23/9
T210820%

A close of the QQQ below 94 would be a serious sign of weakness.   QQQ closed Tuesday at 94.59. IBD has just labeled the “market in correction.” Maybe they heed the GMI signal??!! I am mainly in cash and short the market in my trading accounts.

Note this ominous chart of small cap stocks reflected in the IWM ETF.   There is a double top (horizontal red line), a decline below the critical 30 week average, and a lot of red spikes of high volume on down weeks.   What is this chart telling us about the market?

IWMwkly08052014