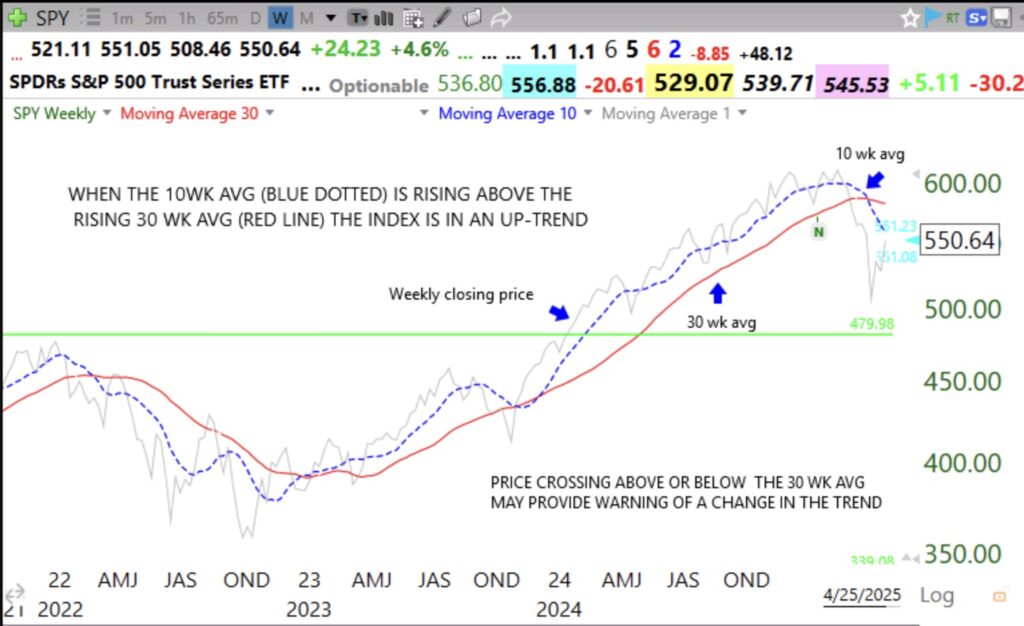
Look at this chart and see the current down-trend pattern of SPY. The 10:30 weekly chart of QQQ tells a similar story. While my short term indicator of QQQ has turned up, note that in any change in trend the shorter term indicator’s trend will change direction first but it does not necessarily mean the longer term trend will also change direction. When the longer term trend eventually turns up, the 10:30 weekly chart will tel me. Will the 2025 decline turn into one like 2022 or 2023? No one knows, but the 30 wk avg is turning down…..

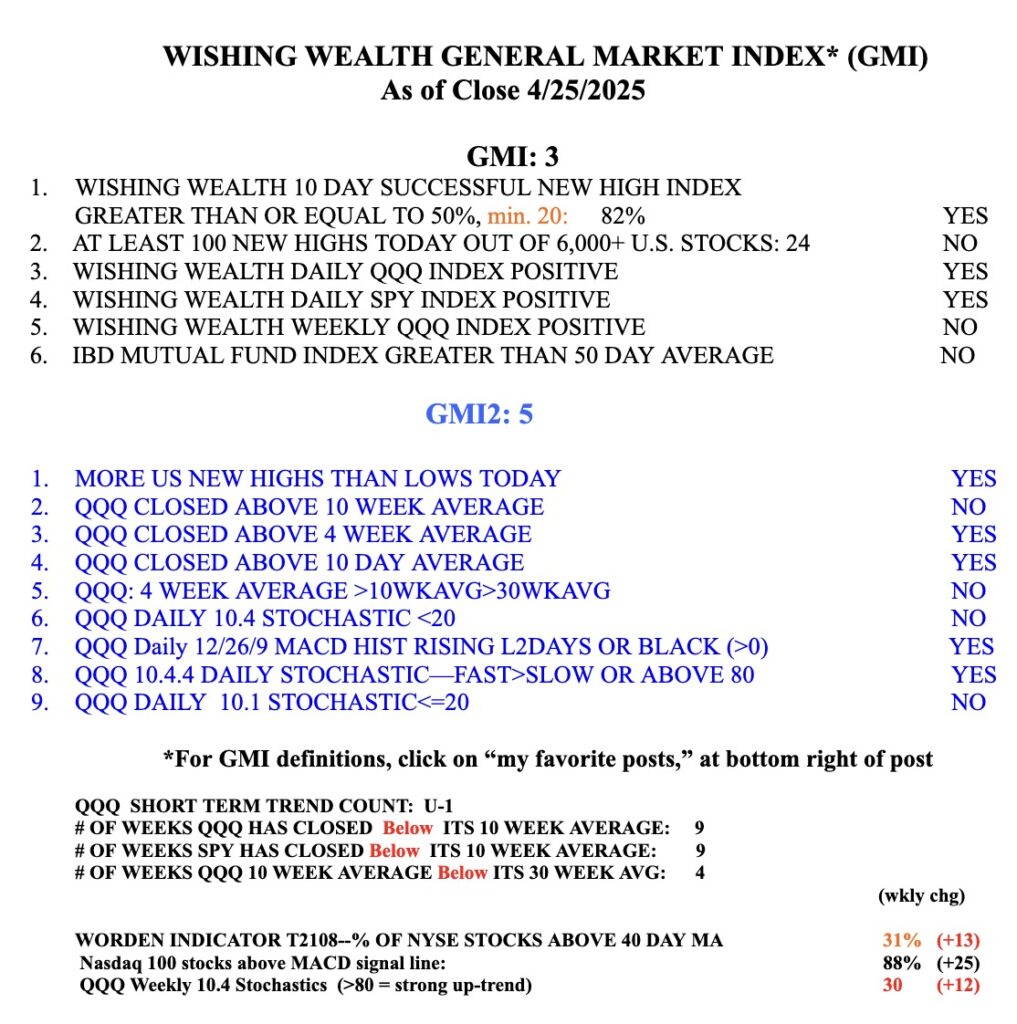
The GMI is now= 3 (of 6), and still RED. Near the bottom of the table I provide a count of the number of weeks QQQ has closed with its 10wk avg above or below the 30 wk avg.
The short term 21 DMA turned up, not the 50 SMA. What you said seemed to say the 50 SMA turned up, which it did not.