Thank you! I broke 31,000 followers on X today!!!!
I reviewed some of my indicators: GLB, Blue Dot of Happiness and daily 8 EMA at the TraderLion conference today. I will post the recording link for Day 6 when I receive it or you can go to traderlion.com to find it.
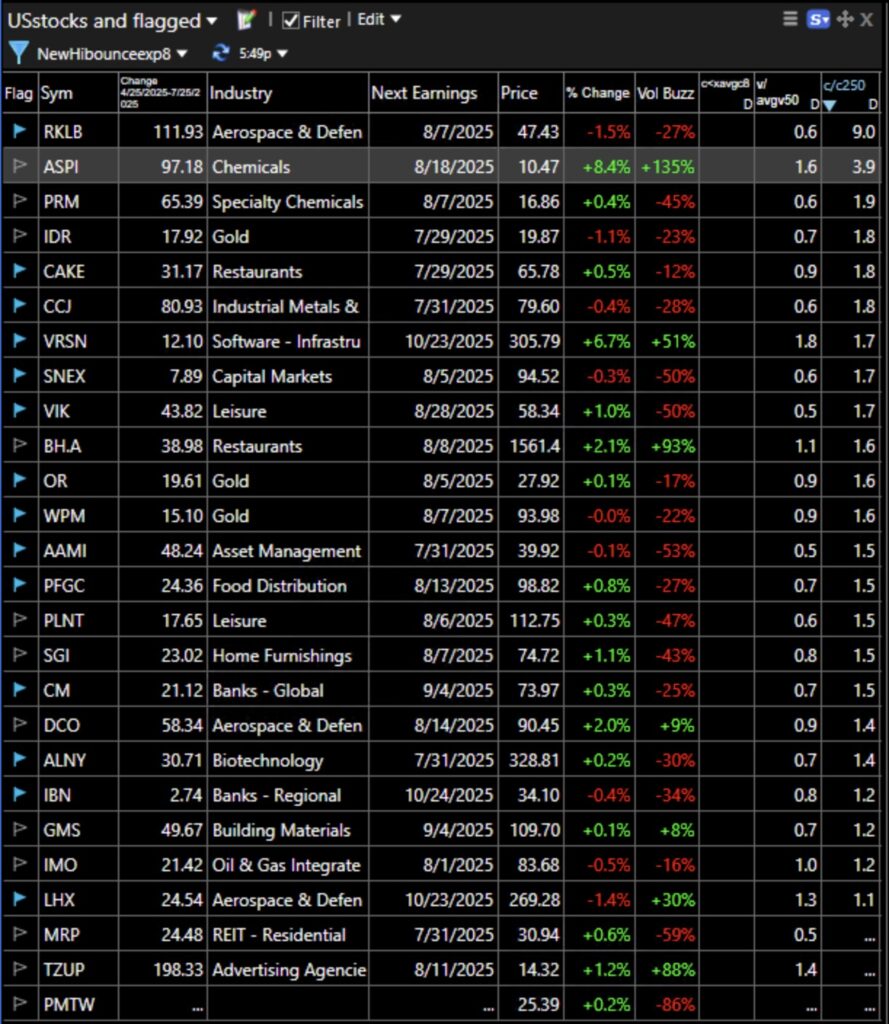
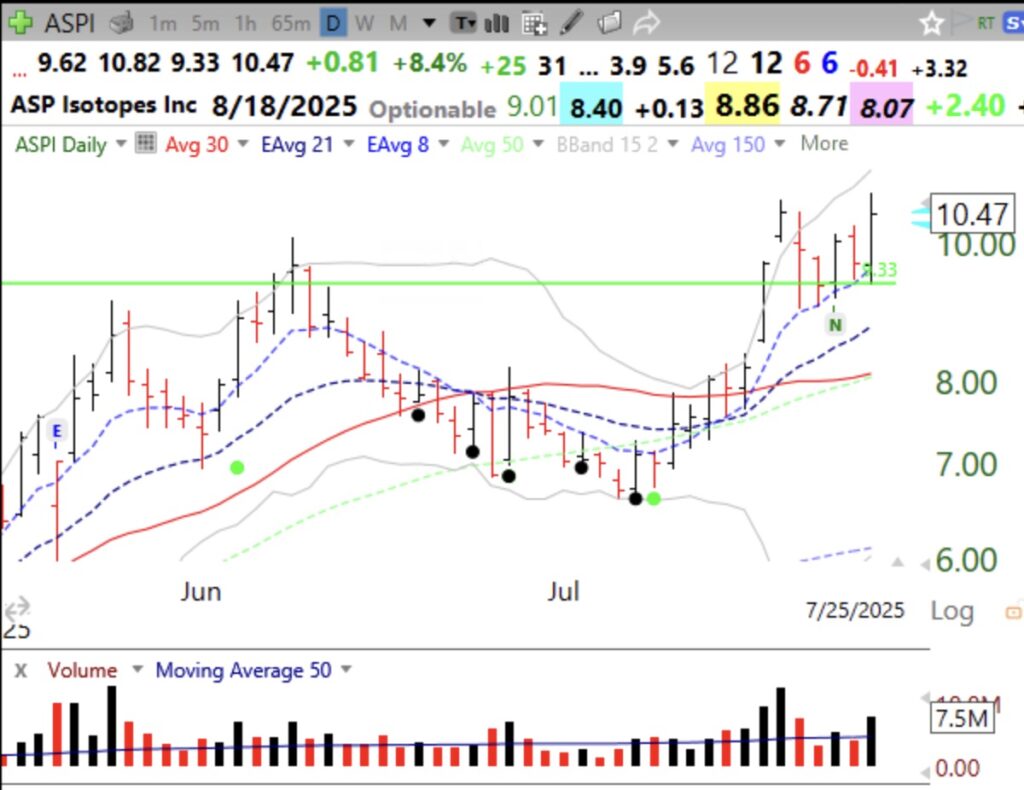
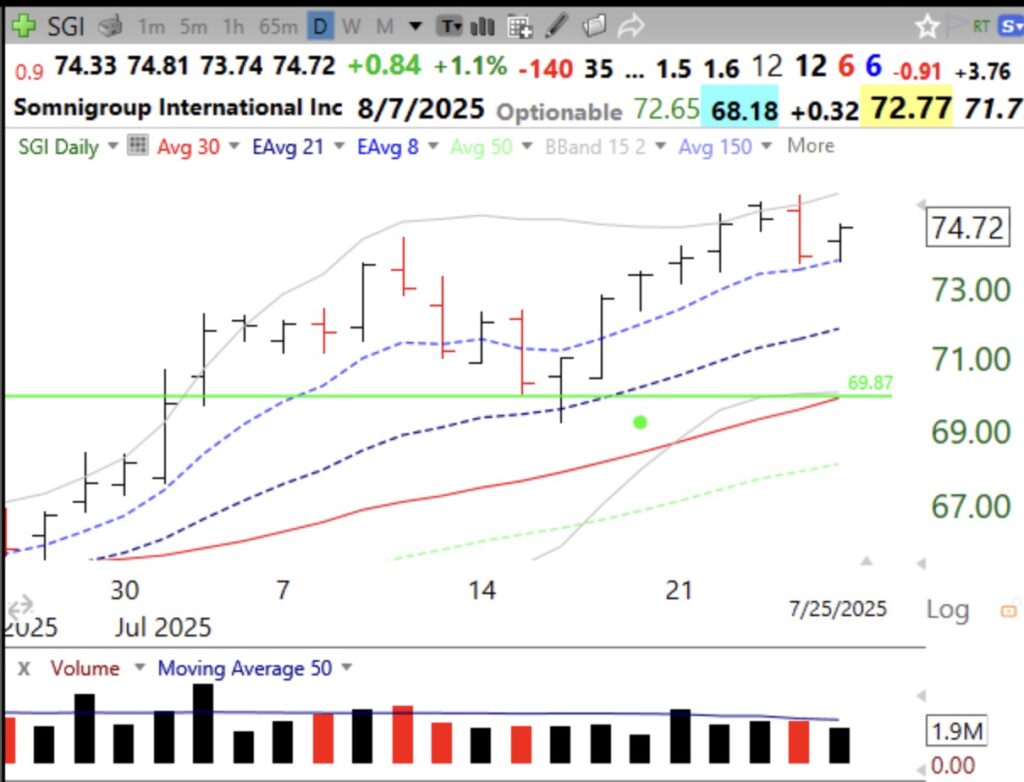
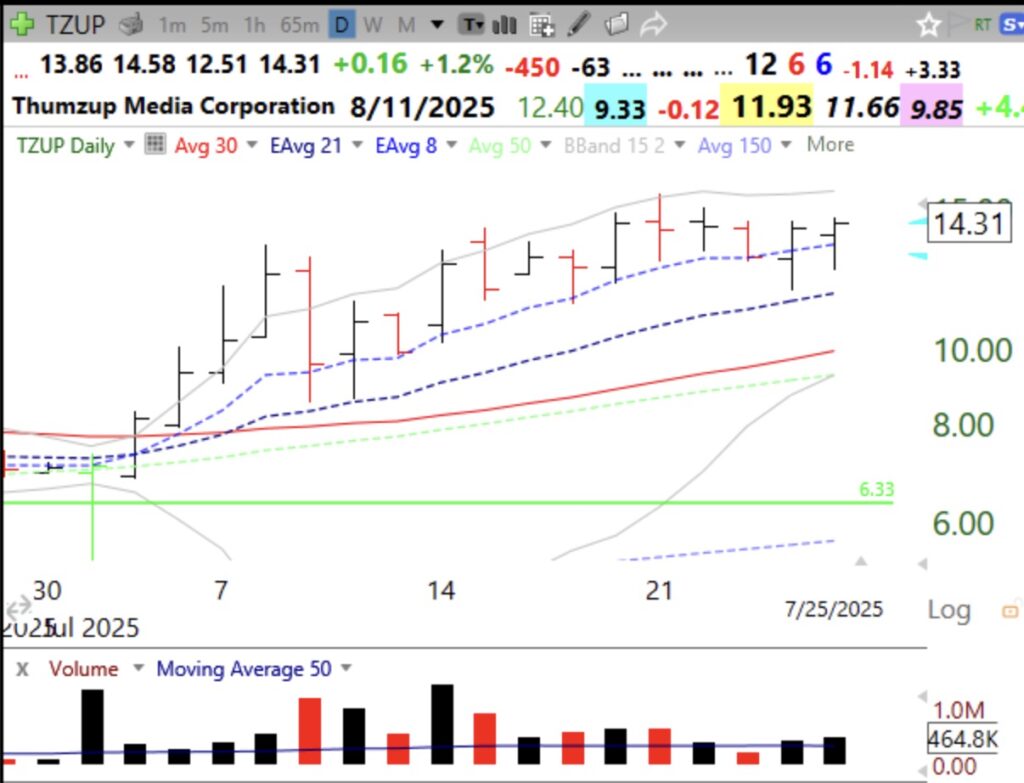
During my presentation I posted a picture of the results of my scan for stocks with a recent ATH, that had bounced their daily 8 EMA, which they had been tracking. I built the scan using TC2000, but Richard will help me to build it with Deepvue when we launch my Masterclass. The scan found 26 out of 6,200 stocks that met these criteria. I sorted them by close Friday divided by their close 250 days earlier, found in the last column. These stocks are for educational purposes only, to learn the setups. Plot them daily with their 8 EMA and explore them. The 3 stocks at the bottom came public in the past year and have no values shown in the last column. Note the different industries in the table and the dates for reporting earnings. All are above their last green line tops. I show below the daily charts of three of them to show you their patterns.
Screenshot
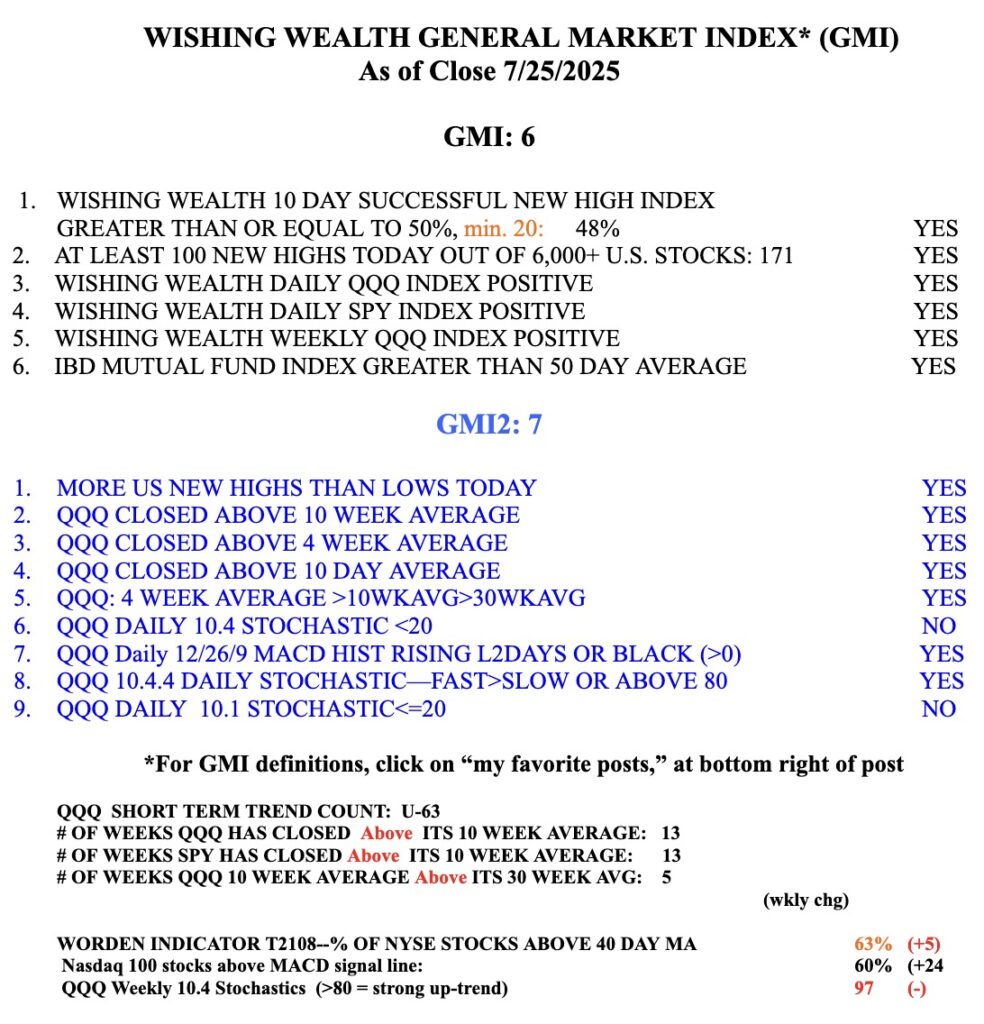
The GMI remains Green and registers 6 (of 6). The weekly 10.4 stochastic of QQQ is 97, showing that QQQ is near the top of its past 10 week range, a powerfully bullish sign.