Skip to content

Wishing Wealth Blog

Stock Market Technical Indicators & Analysis

  • Home
  • About
    • Disclaimer
    • Contact
  • Recommended Reading
  • Topics
    • General Market Index (GMI) table
    • Nicolas Darvas
    • My Favorite Posts
    • Tutorial
    • UMDSMC Education Posts
    • Video blog
  • Webinars
    • TraderLion 25 Annual Conference
    • 2025-07-17 Long Island Traders Meetup
    • Boston IBD Meetup, May 21, 2025
    • 01/2024 NoVA IBD Meetup
    • AAII
      • Eastern Michigan – 01/2022
      • Research Triangle – 12/2021
    • 2021 TraderLion Presentation
    • 2022 TraderLion Webinar
    • TC2000 User Group – December 2012
    • 2012 Houston TC2000 Webinar
    • Doctor’s Orders – August 2010
    • A Word from Dr. Wish – April 2010
    • Other Dr. Wish Videos…
  • Glossary
  • $25 Coupon for TC2000

Dr. Wish

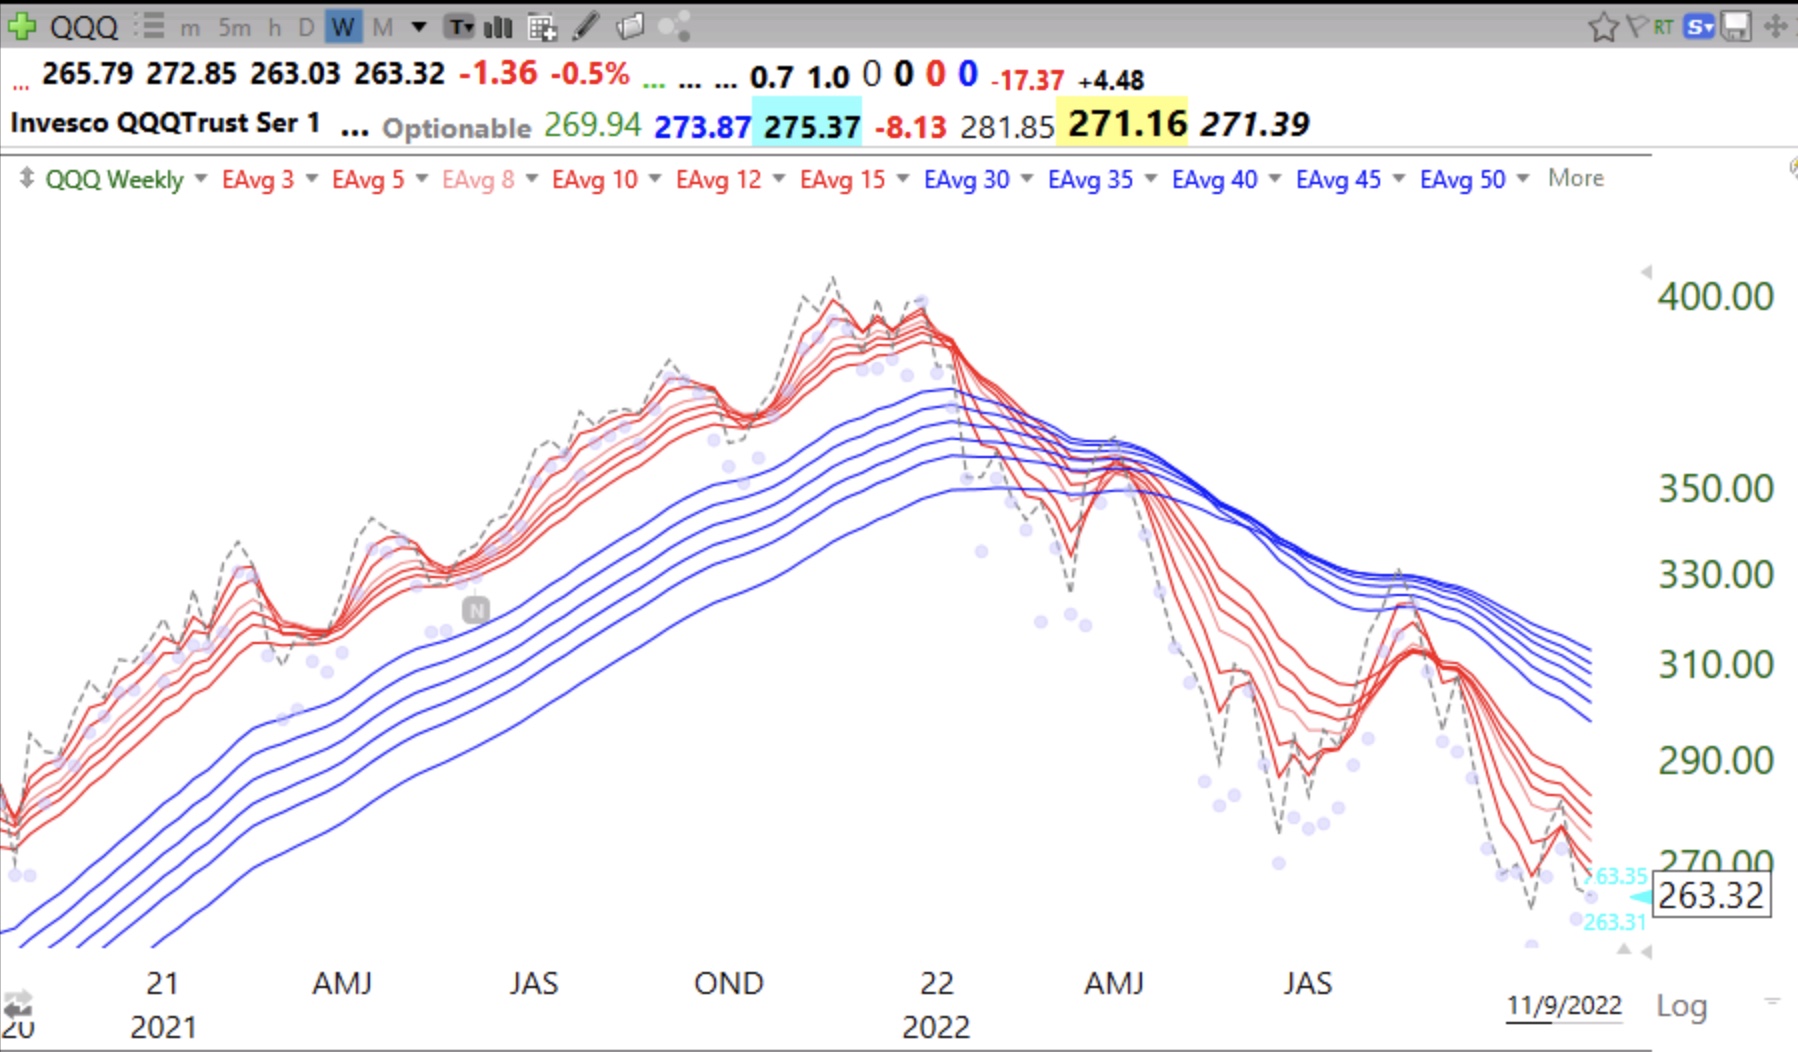
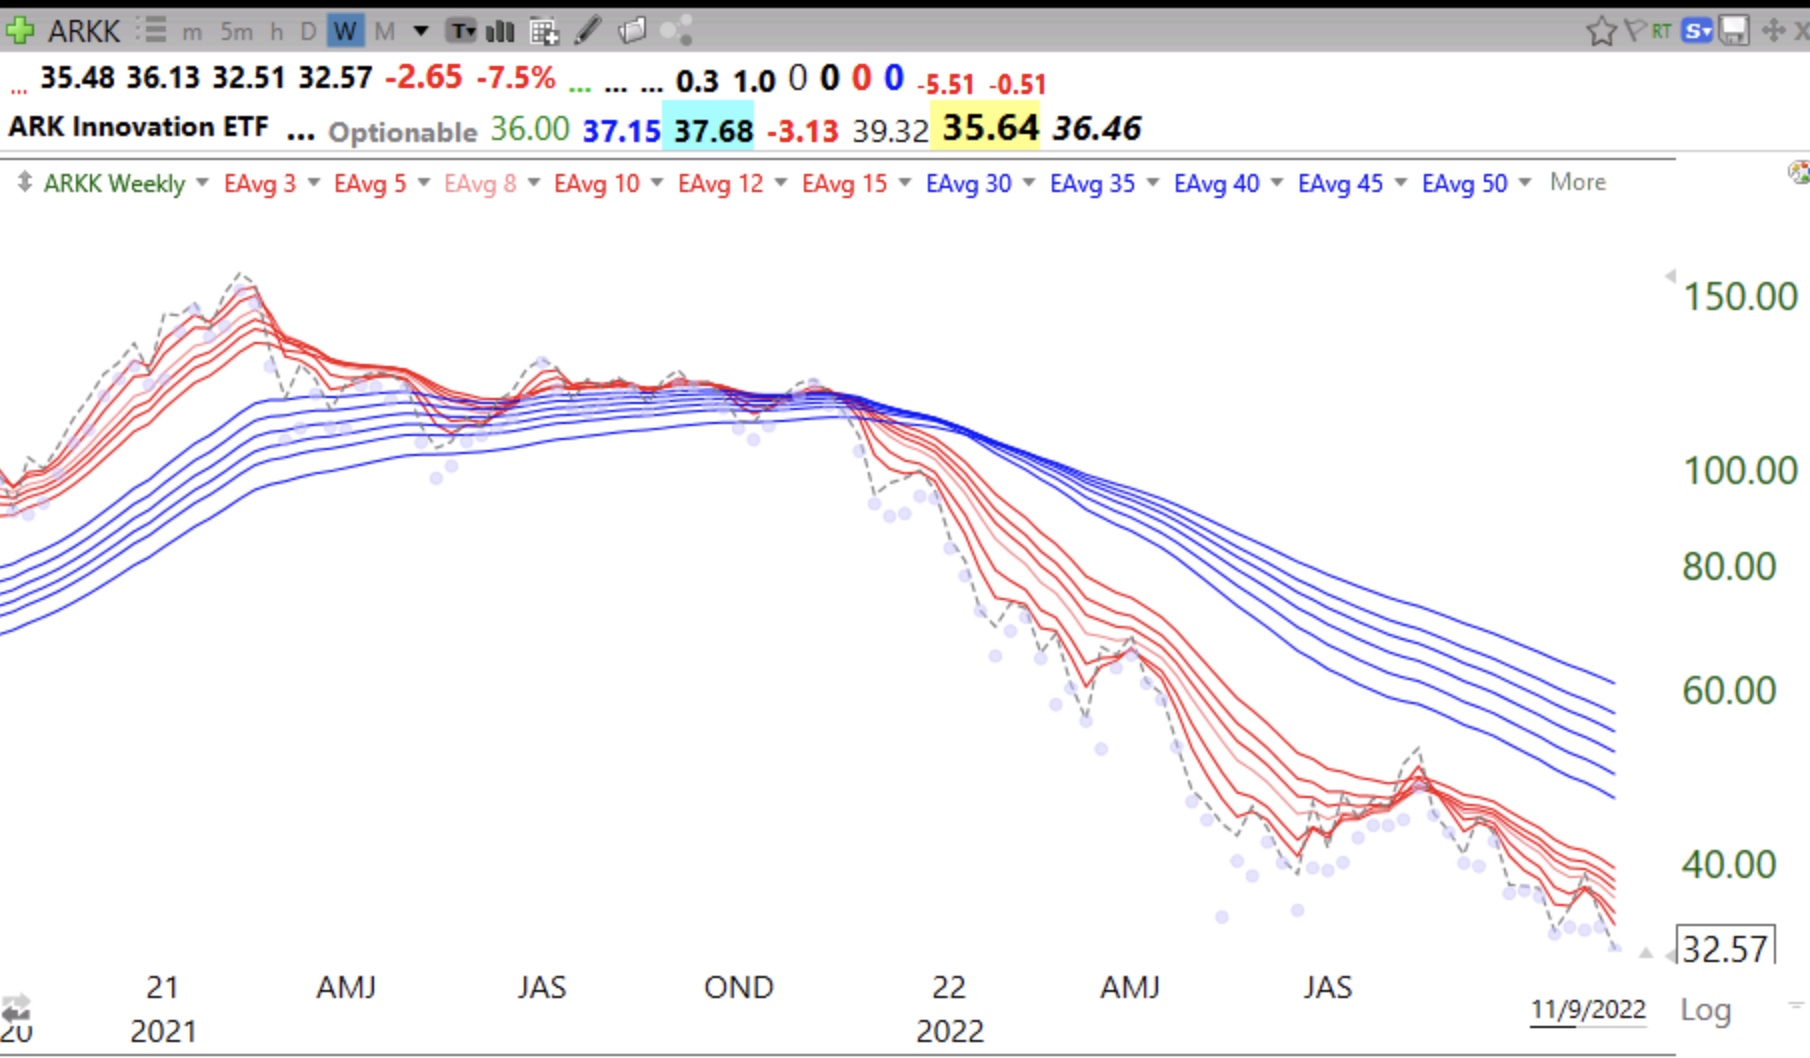
Blog Post: Day 5 of $QQQ short term down-trend; GMI=2, could turn Red Thursday; 96 US new highs and 513 lows; $QQQ and $ARKK in ominous weekly BWR down-trends, see charts

Wednesday, November 9, 2022 @ 5:44 pm by Dr. Wish
GMI2/6
GMI-21/9
T210857%

Leave a comment

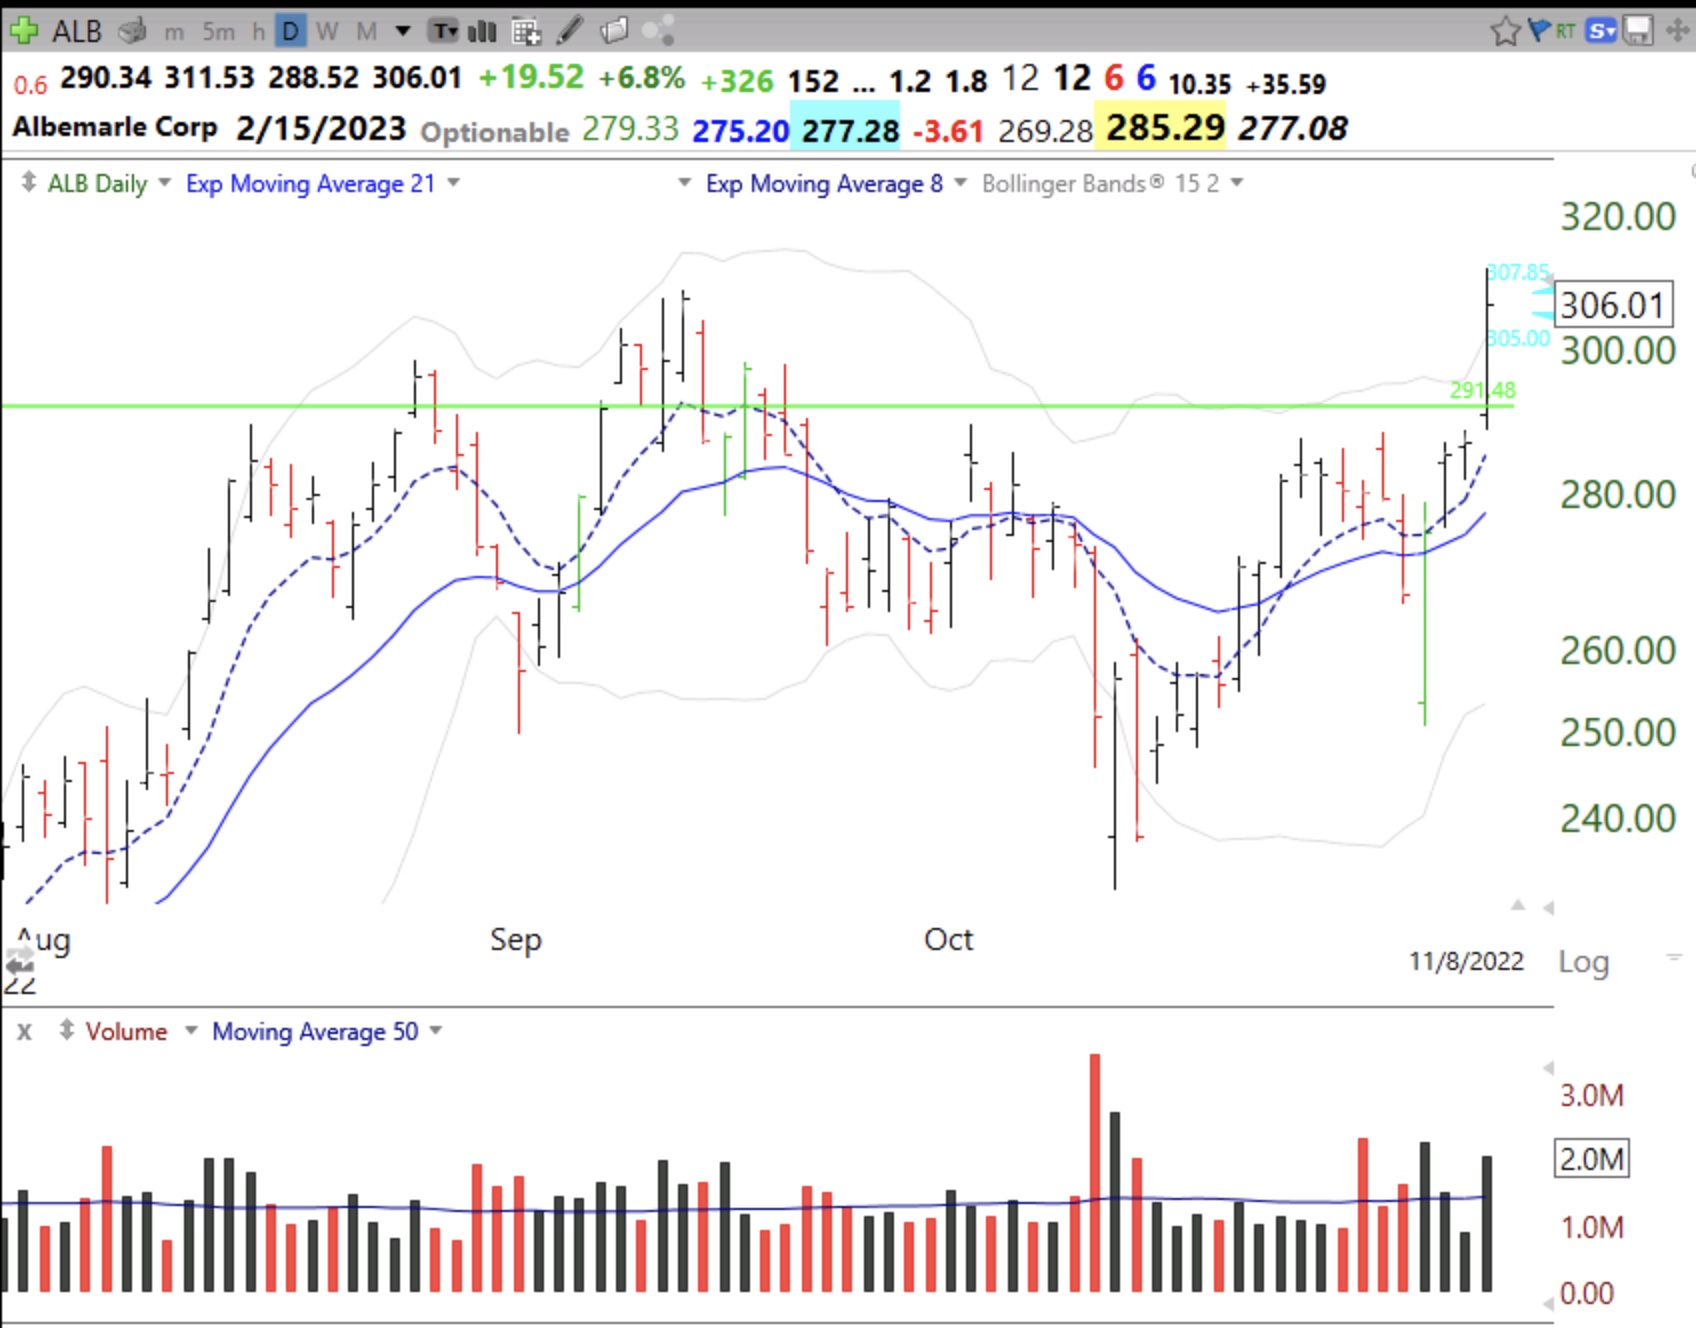
Blog Post: Day 4 of $QQQ short term down-trend; $ALB retakes green line on above average volume, see chart

Tuesday, November 8, 2022Tuesday, November 8, 2022 @ 9:56 pm by Dr. Wish
GMI3/6
GMI-22/9
T210863%

Leave a comment

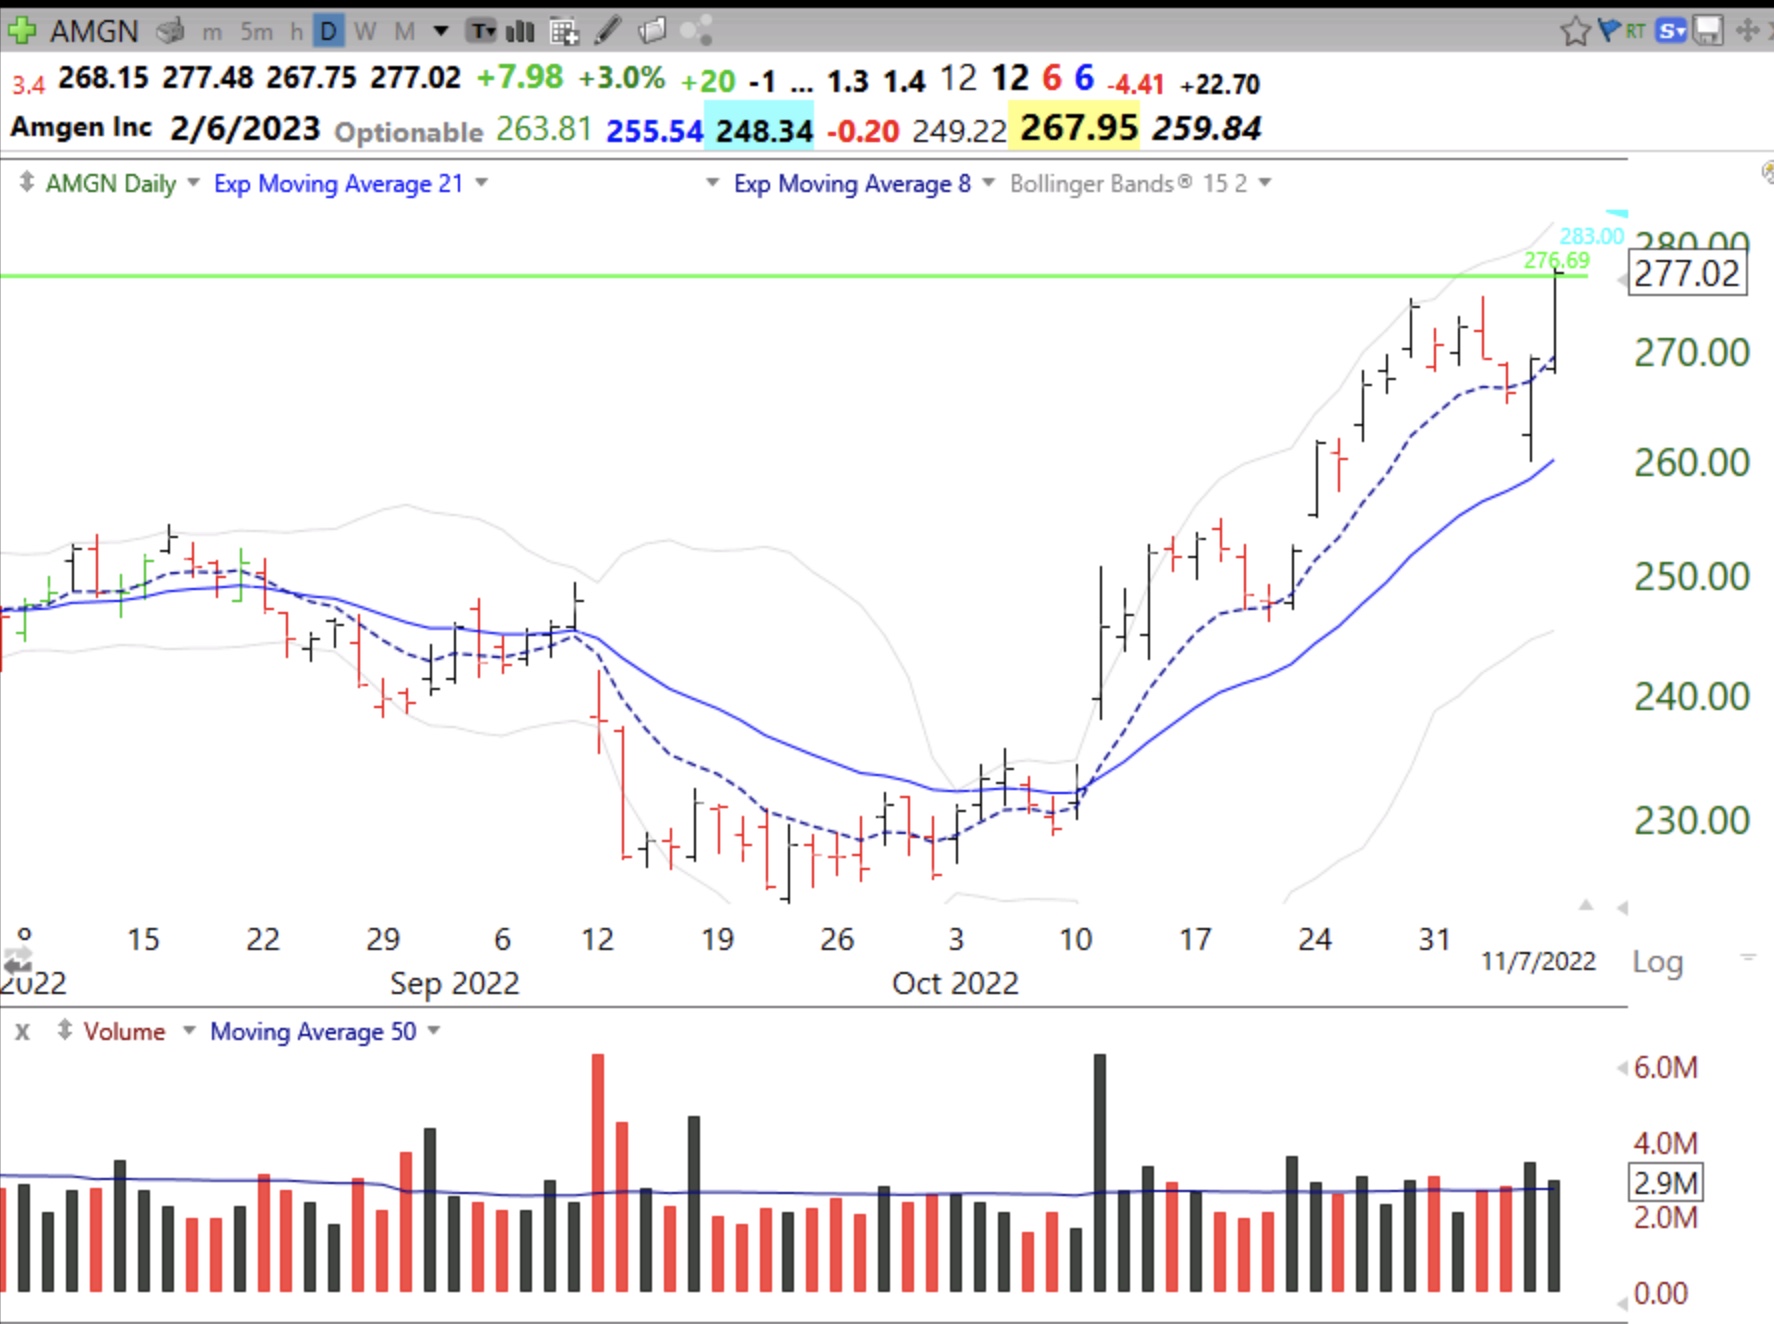
Blog Post: 146 US new highs and 258 lows; Day 3 of $QQQ short term down-trend; $AMGN has GLB, see chart

Monday, November 7, 2022 @ 8:39 pm by Dr. Wish
GMI3/6
GMI-21/9
T210862%

Leave a comment
Older posts
Newer posts
← Previous Page1 … Page176 Page177 Page178 Page179 Page180 Page181 Page182 … Page1,524 Next →

Current GMI Signal

GREEN

since close on May 5, 2024

Successful GLBTracker

Selected stocks that have had a successful recent Green Line Breakout (GLB). One can really profit by buying stocks breaking out to all-time highs after a consolidation of 3 months or more, my GLB Setup.

Sym.DateGLB $Now $Chg.
HWM11/14/23$51.34$197.51284.71%
SFM1/29/24$49.45$110.28123.01%
CRS4/23/24$79.66$247.51210.71%
AGX9/6/24$76.70$281.71267.29%
BKNG9/16/24$3,918.00$5,290.7535.04%
APP9/17/24$116.09$552.50375.92%
DUOL9/18/24$245.87$319.7830.06%
EAT10/1/24$78.33$133.4070.31%
NFLX10/18/24$700.99$1,239.8276.87%
LRN10/23/24$69.70$151.34117.13%
PLTR11/5/24$44.91$181.85304.92%
SPOT11/6/24$387.44$688.9977.83%
CRWD4/24/25$398.33$504.7026.70%
CLS5/1/25$87.00$265.43205.09%
RGC5/1/25$1.55$16.30951.61%
CCJ6/9/25$62.55$82.5331.94%
SEZL5/9/25$79.59$75.52-5.11%
CRWV5/14/25$64.62$124.6292.85%
GEV5/20/25$447.50$585.2330.78%
NVDA6/3/25$140.76$181.4628.91%
MIRM8/7/2025$54.23$68.6926.66%
CCJ6/9/25$62.55$82.5331.94%
ORCL6/12/25$198.31$275.4138.88%
QBTS5/20/25$13.23$32.09142.55%
IONQ9/12/25$54.74$59.658.97%
HOOD6/30/25$85.60$131.8554.03%
IREN9/9/2025$28.25$54.9894.62%

Indicators in your Inbox

Get new posts by email:
PopularMost DiscussedRecent
  • About the General Market Index (GMI)
  • Welcome to the new *and improved* Wishing Wealth
  • How to use IBD 100 and New America stocks and TC2007 to find potential rocket stocks; Market rally begins
  • The new 3x ETF’s–triple your pleasure — or pain
  • My first YouTube Vlog (video blog) Post: Sell in May and Go Away?
  • In the hospital. Will resume posting next week. Thank you for your patience.
  • How I use put options as investment insurance
  • My first YouTube Vlog (video blog) Post: Sell in May and Go Away?
  • So, Wishing Wealth Reader, Tell Us About Yourself…
  • Blog post: David, my co-presenter, brilliant colleague of 20+ years died in a freak accident on 2/18; Day 35 of $QQQ short term down-trend; 15 promising stocks to monitor
  • Blog Post: Day 40 of $QQQ short term up-trend; Up-trend continues, GMI=6 and $AAPL has a GLB after a Blue Dot of Happiness signal, see daily chart.
  • Blog Post: Day 39 of $QQQ short term up-trend; Much weakness on Friday: more new lows than highs and only 8 at ATH, lowest since April 24! Another possible head and shoulder’s top forming, see daily chart. GMI=4 but Green, see table.
  • Blog Post: Day 38 of $QQQ short term up-trend; Banks and NYSE stocks are cratering and GLD keeps rising; something bad may be about to happen, reminds me of 2008, see charts.
  • Blog Post: Day 37 of $QQQ short term up-trend; Check out this amazing daily chart showing how $GLD has closed above its 5 EMA every day but one since August 22! See also $IREN, and how I trade this pattern.
  • Blog Post: Day 35 of $QQQ short term up-trend; $QQQ has a blue dot (oversold bounce), GMI back to 5 (of 6).

Blogroll

  • Barchart All-Time Highs
  • Blue Collar Investor
  • CNNMoney: Pre-market Futures
  • Dark Liquidity
  • Seeking Alpha
  • Stock Chartist

Recommended Reading

QQQ and TQQQ ETF Profit Machine Momentum Masters - A Roundtable Interview with Super Traders - Minervini, Ryan, Zanger & Ritchie II Alan Ellman's Selling Cash-Secured Puts: Investing to Generate Monthly Cash Flow Stock Investing For Students - a plan to get rich slowly and retire young Trade Like a Stock Market Wizard: How to Achieve Super Performance in Stocks in Any Market Exit Strategies for Covered Call Writing: Making the Most Money When Selling Stock Options Complete Encyclopedia for Covered Call Writing Wall Street The Other Las Vegas How to Make Money in Stocks: A Winning System in Good Times and Bad, Fourth Edition Trend Trading: A seven step approach to success How Legendary Traders Made Millions: Profiting From the Investment Strategies of the Gretest Traders of All time The Complete TurtleTrader: The Legend, the Lessons, the Results How to Make Money Selling Stocks Short Reminiscences of a Stock Operator Stan Weinstein's Secrets For Profiting in Bull and Bear Markets Lessons from the Greatest Stock Traders of All Time How I Made $2,000,000 In The Stock Market

Archives

© 2025 WishingWealthBlog.com
 

Loading Comments...