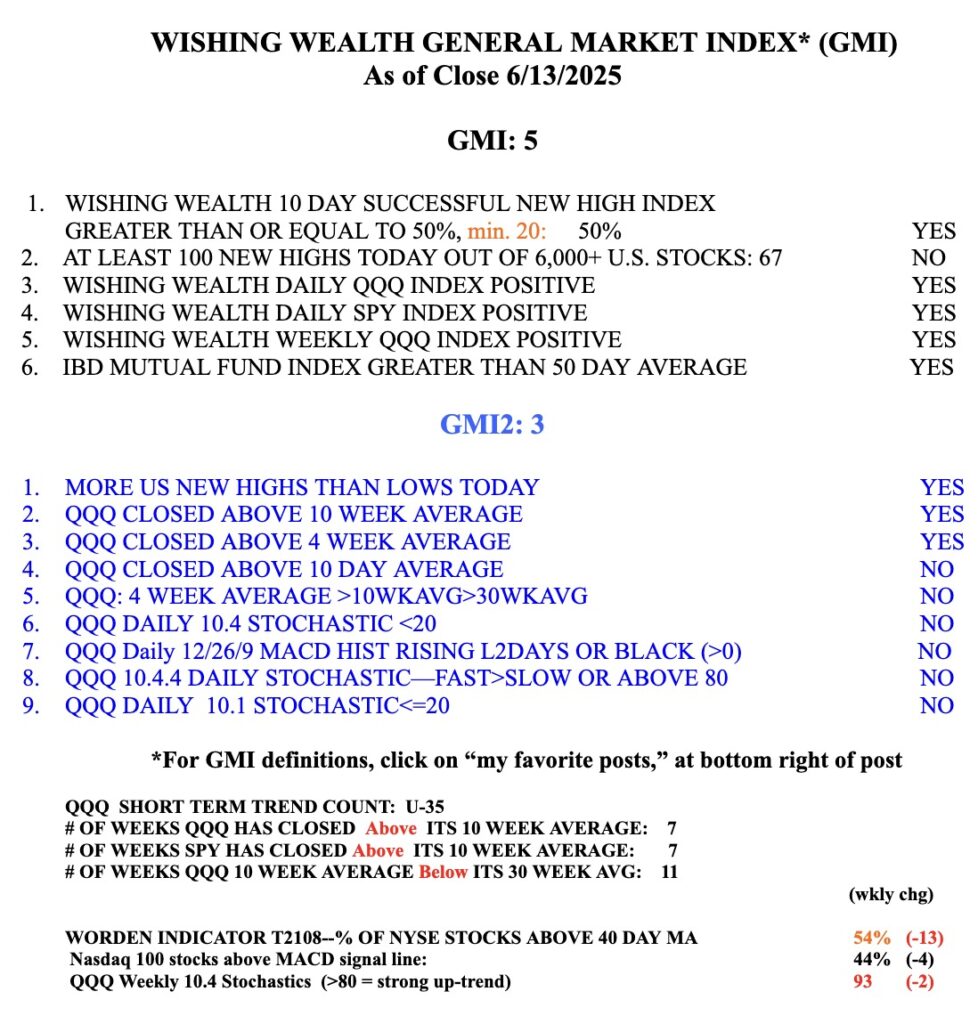
Blog Post: Day 4 of $QQQ short term up-trend; Slowly adding $TQQQ and some individual stocks near their ATHs; $BJ has another blue dot set-up, see daily chart.

GMI3/6
GMI-26/9
T210837%

BJ has had another blue dot after a recent ATH set-up. This set-up is one of my favorites. I sell if the bounce from oversold fails. I will explain this set-up during my presentation at the Boston IBD Meetup on the evening of May 21. It is free and if you register in advance, they will send you the recording of the meeting. I will send you the link to register closer to the meeting date. BJ has shown a lot of relative strength recently, refusing to decline with the market.

Screenshot


Blog Post: Day 1 of $QQQ short term up-trend but 25% end within 5 days; Study this annotated 10:30 weekly chart of $SPY and $QQQ to see how I assess their primary trends.

GMI3/6
GMI-25/9
T210831%

Look at this chart and see the current down-trend pattern of SPY. The 10:30 weekly chart of QQQ tells a similar story. While my short term indicator of QQQ has turned up, note that in any change in trend the shorter term indicator’s trend will change direction first but it does not necessarily mean the longer term trend will also change direction. When the longer term trend eventually turns up, the 10:30 weekly chart will tel me. Will the 2025 decline turn into one like 2022 or 2023? No one knows, but the 30 wk avg is turning down…..

Screenshot
Screenshot


The GMI is now= 3 (of 6), and still RED. Near the bottom of the table I provide a count of the number of weeks QQQ has closed  with its 10wk avg above or below the 30 wk avg.

Screenshot