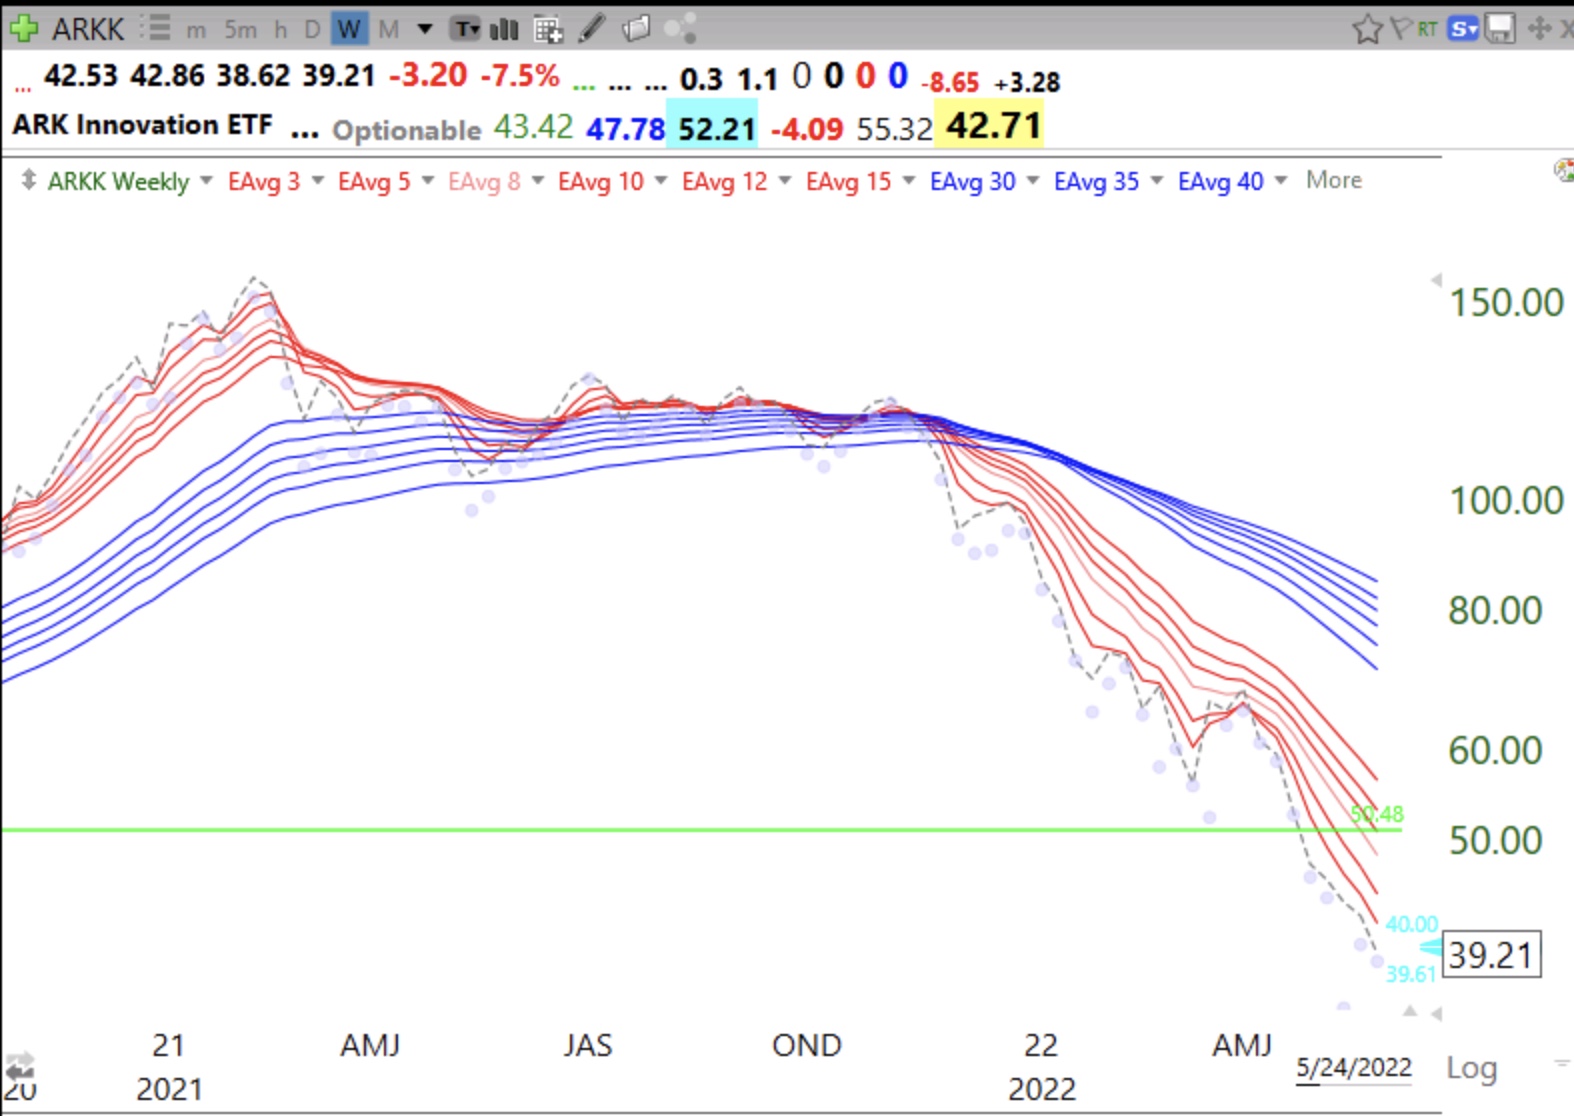
Note its RWB up-trend in 2020 when one could make money owning it. RWB is the pattern I want in order to buy a growth stock. Who knows when the current weekly BWR pattern will end.
Stock Market Technical Indicators & Analysis
Note its RWB up-trend in 2020 when one could make money owning it. RWB is the pattern I want in order to buy a growth stock. Who knows when the current weekly BWR pattern will end.
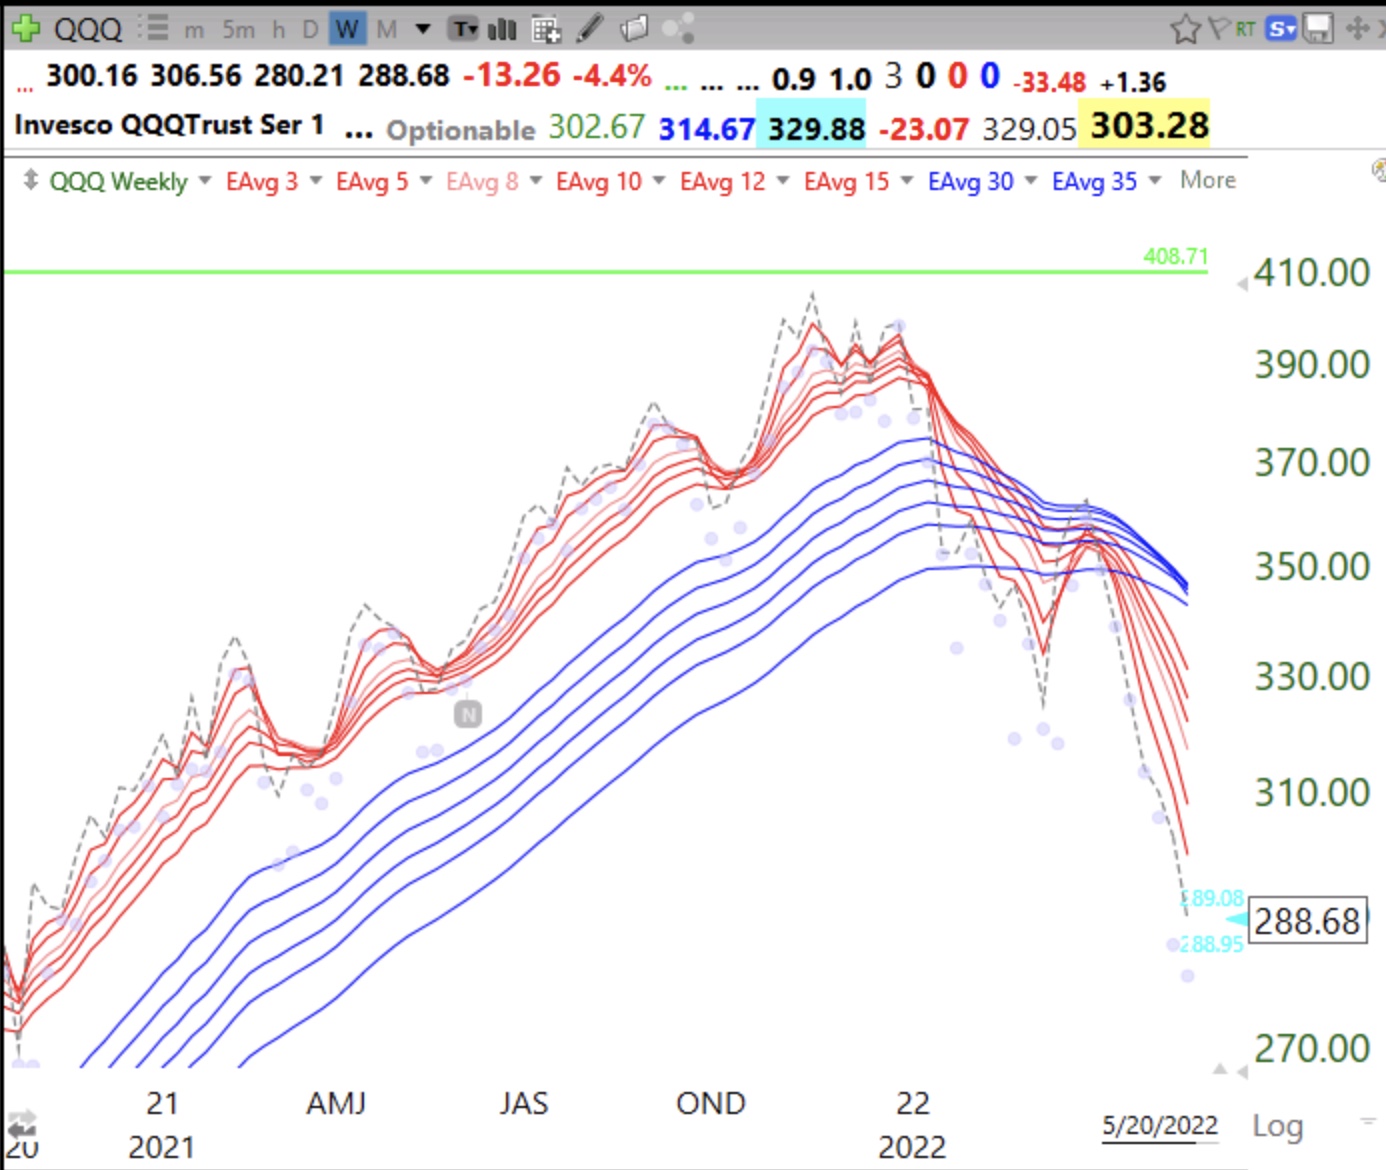
With the GMI=0 I am content to wait for the end of the decline. I got out of the market in November and I do not have to try to guess the bottom. As long as I get back in at a price lower than where I sold I have done well and avoided all of the stress of a large drawdown. Too many people think they have to catch the bottom–ridiculous! It is so much easier to make money going long when the GMI is on a Green signal. That occurs when there are two consecutive days with the GMI>3. I will also want to have the indexes in a weekly RWB up-trend. See below that QQQ is in a weekly BWR down-trend with all of the shorter averages (red lines) below the declining longer averages (blue lines). It looks like this may even be the beginning of a major down-trend. However, I do not become attached to a scenario. I just wait for Mr. Market to tell me his direction.