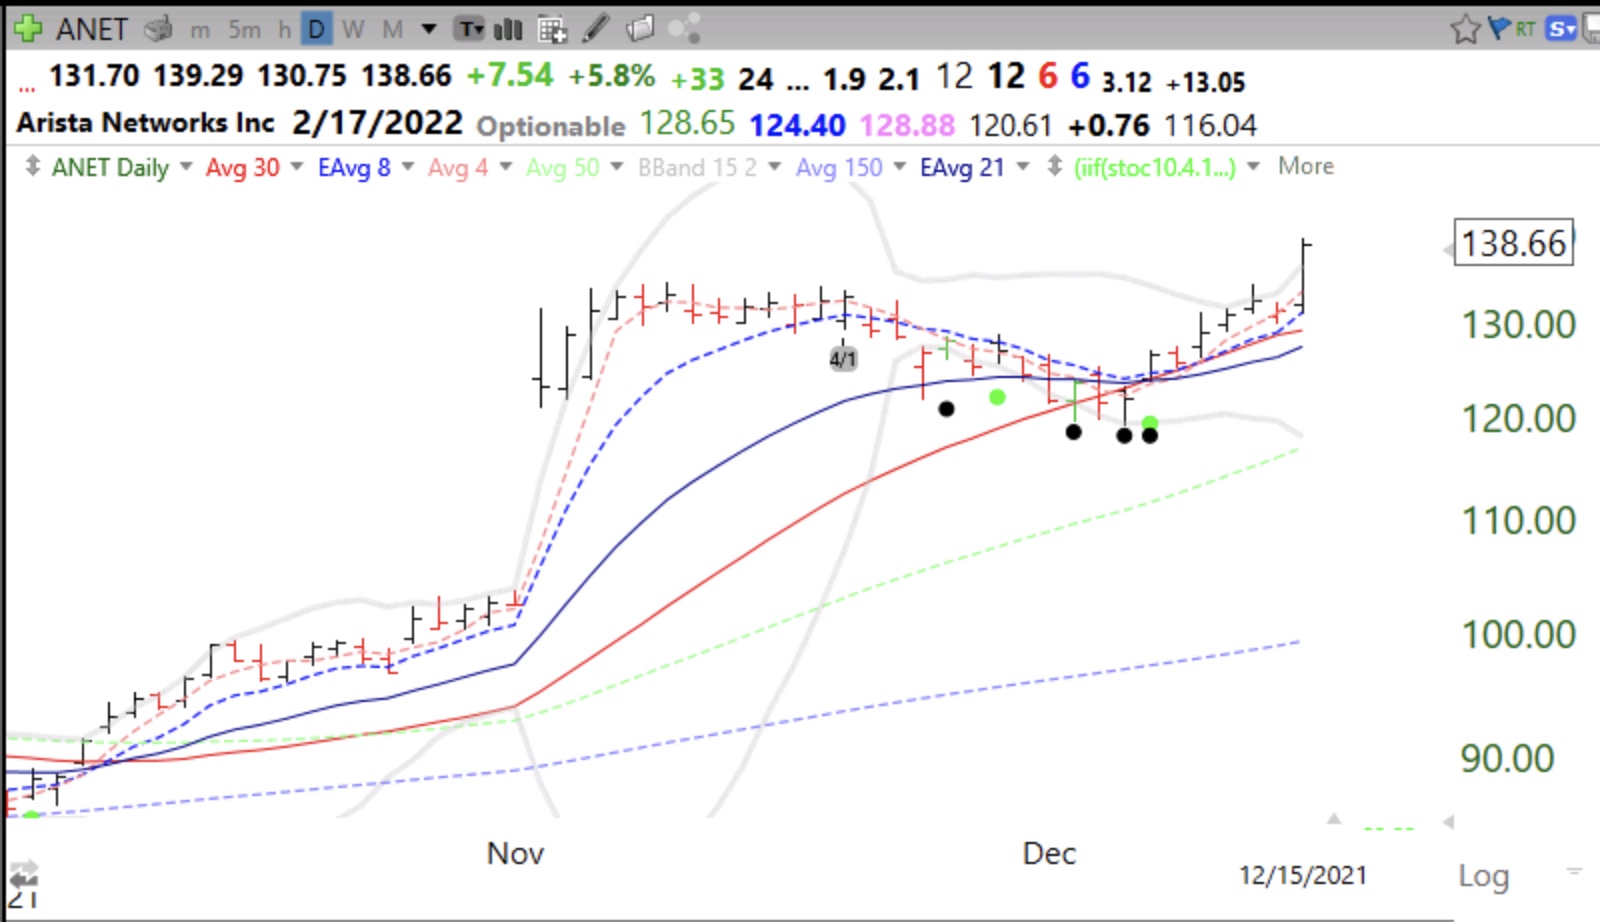
ANET had a huge gap up after earnings on November 2nd, then had a 4 for 1 split and entered a 5 week consolidation, culminating in black and green dot oversold signals. It broke to an all-time-high (ATH) with Wednesday’s rally. I have a position.
Stock Market Technical Indicators & Analysis
ANET had a huge gap up after earnings on November 2nd, then had a 4 for 1 split and entered a 5 week consolidation, culminating in black and green dot oversold signals. It broke to an all-time-high (ATH) with Wednesday’s rally. I have a position.
Daily RWB pattern is failing. Note last October rise where QQQ closed each day (dotted line) above all averages. That is what we are looking for in a meaningful reversal.
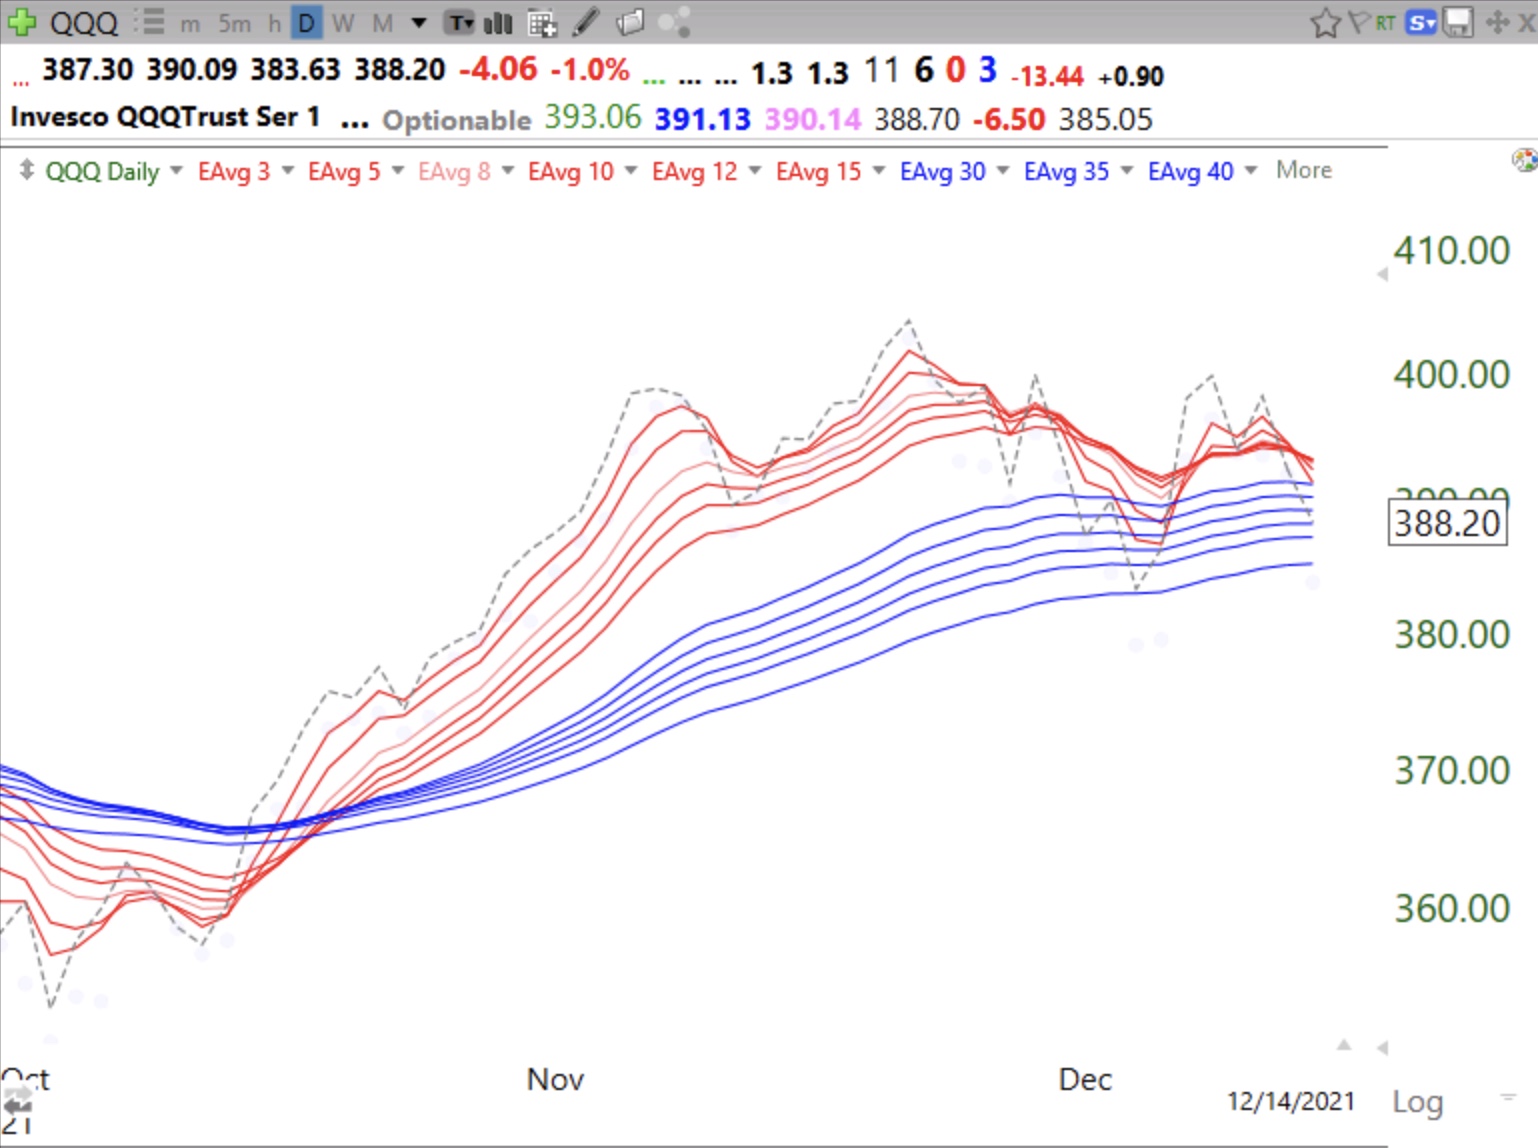
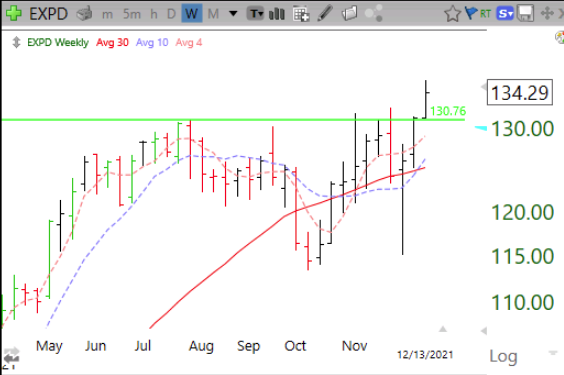
QQQ is right on support. By week’s end we will find out if the market rallies or swoons. It may wait until after the Fed reports on Wednesday at 2:00 PM. Meanwhile EXPD had a GLB. Check out its weekly chart. Must not close below 130.76.