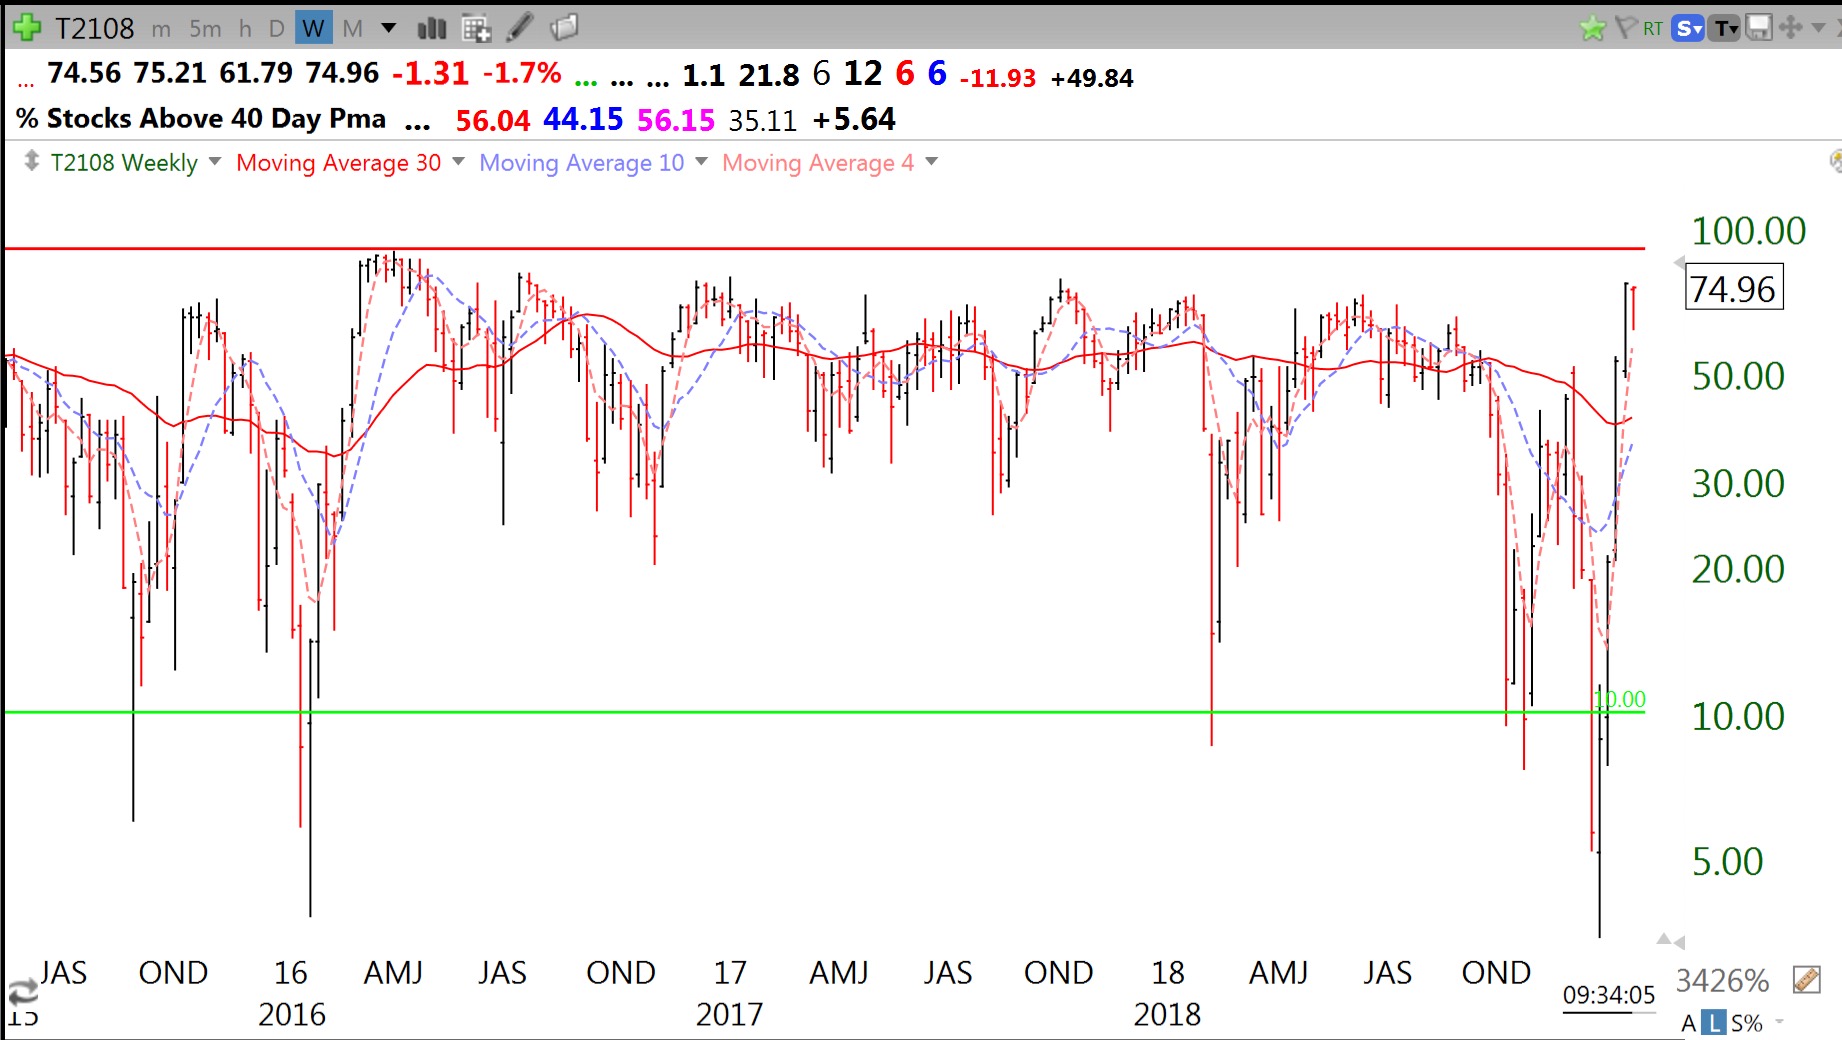
I never have the courage to buy the SPY when T2108 reaches single digits 🙁 Check out this weekly chart.
Stock Market Technical Indicators & Analysis
I never have the courage to buy the SPY when T2108 reaches single digits 🙁 Check out this weekly chart.
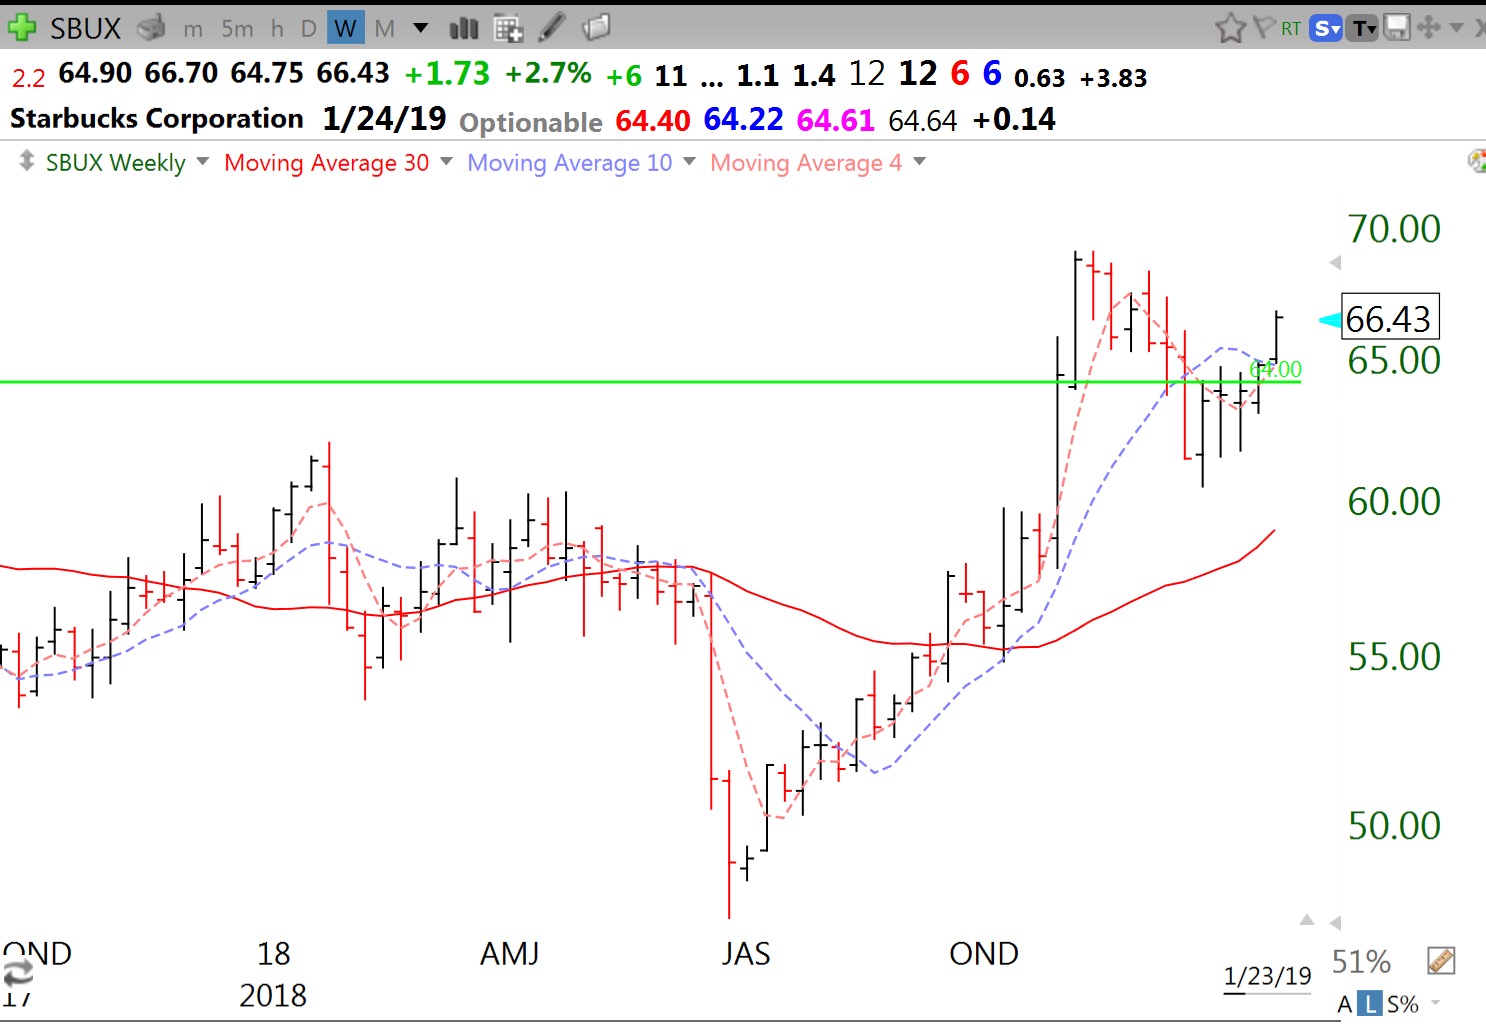
Weekly chart shows SBUX retested recent GLB.