Skip to content

Wishing Wealth Blog

Stock Market Technical Indicators & Analysis

  • Home
  • About
    • Disclaimer
    • Contact
  • Recommended Reading
  • Topics
    • General Market Index (GMI) table
    • Nicolas Darvas
    • My Favorite Posts
    • Tutorial
    • UMDSMC Education Posts
    • Video blog
  • Webinars
    • TraderLion 25 Annual Conference
    • 2025-07-17 Long Island Traders Meetup
    • Boston IBD Meetup, May 21, 2025
    • 01/2024 NoVA IBD Meetup
    • AAII
      • Eastern Michigan – 01/2022
      • Research Triangle – 12/2021
    • 2021 TraderLion Presentation
    • 2022 TraderLion Webinar
    • TC2000 User Group – December 2012
    • 2012 Houston TC2000 Webinar
    • Doctor’s Orders – August 2010
    • A Word from Dr. Wish – April 2010
    • Other Dr. Wish Videos…
  • Glossary
  • $25 Coupon for TC2000

Dr. Wish

High Volume Selling of $DIA and $SPY at End of Day

Wednesday, October 3, 2018 @ 8:35 pm by Dr. Wish
GMI4/6
GMI-26/9
T210839%

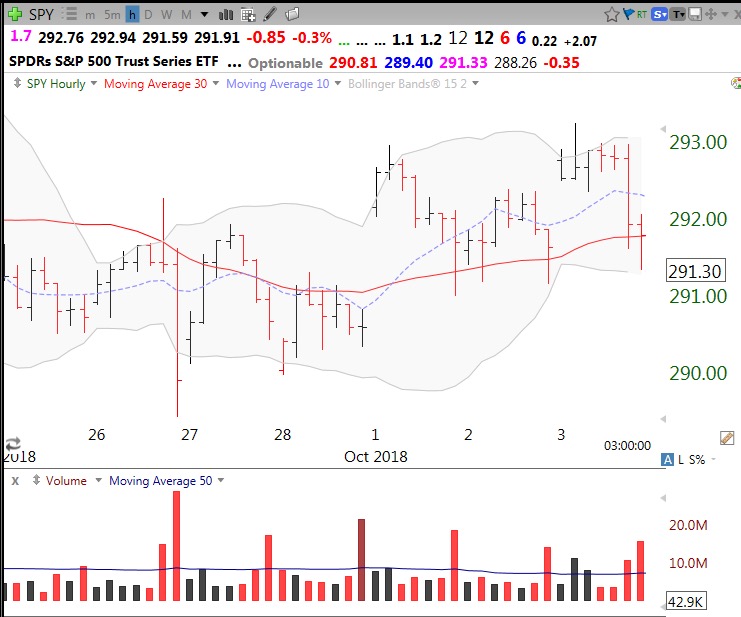
I do not usually look at hourly charts but did tonight. This chart of DIA shows a lot of selling at the end of day the past week. A similar pattern can be seen in the SPY. What do the big boys know that is causing them to sell at the end of the day?
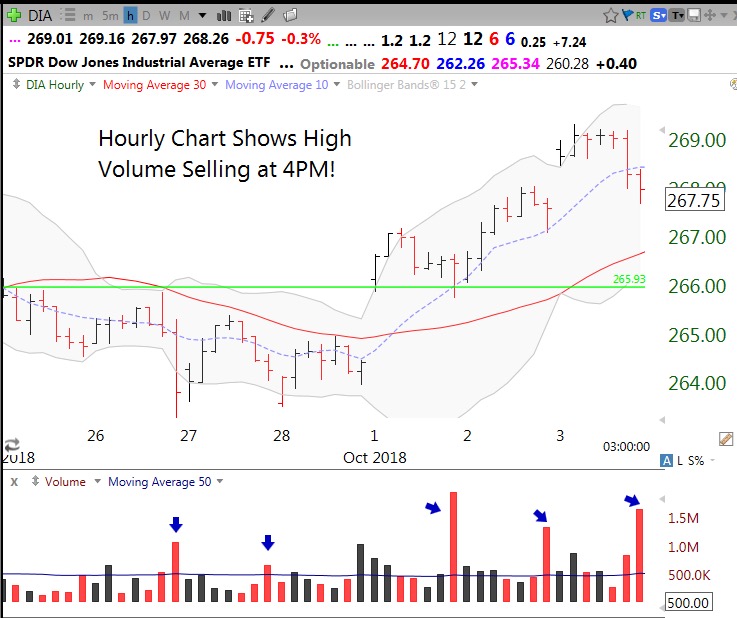
Will post again next Sunday night.

Leave a comment

Warning signs abound

Wednesday, October 3, 2018 @ 10:16 am by Dr. Wish
GMI4/6
GMI-26/9
T210837%

More daily new lows than highs; only 32% of US stocks advance; T2108 at lowest level since last April. The GMI is now at 4 (of 6). XLF and XLB are weak. And short rates are on a steady rise:

Leave a comment

Long bonds decline; 60th day of $QQQ short term up-trend

Monday, October 1, 2018 @ 10:28 pm by Dr. Wish
GMI5/6
GMI-27/9
T210839%

This chart shows the renewed decline on Monday in 20 year treasury bonds. Long rates are rising.

Leave a comment
Older posts
Newer posts
← Previous Page1 … Page506 Page507 Page508 Page509 Page510 Page511 Page512 … Page1,523 Next →

Current GMI Signal

GREEN

since close on May 5, 2024

Successful GLBTracker

Selected stocks that have had a successful recent Green Line Breakout (GLB). One can really profit by buying stocks breaking out to all-time highs after a consolidation of 3 months or more, my GLB Setup.

Sym.DateGLB $Now $Chg.
HWM11/14/23$51.34$189.99270.06%
SFM1/29/24$49.45$106.59115.55%
CRS4/23/24$79.66$241.99203.78%
AGX9/6/24$76.70$294.72284.25%
BKNG9/16/24$3,918.00$5,253.8534.10%
APP9/17/24$116.09$590.11408.32%
DUOL9/18/24$245.87$330.0034.22%
EAT10/1/24$78.33$128.5064.05%
NFLX10/18/24$700.99$1,219.0373.90%
LRN10/23/24$69.70$144.99108.02%
PLTR11/5/24$44.91$177.21294.59%
SPOT11/6/24$387.44$692.0478.62%
CRWD4/24/25$398.33$508.6127.69%
CLS5/1/25$87.00$261.06200.07%
RGC5/1/25$1.55$17.991060.65%
CCJ6/9/25$62.55$92.1547.32%
SEZL5/9/25$79.59$77.01-3.24%
CRWV5/14/25$64.62$141.62119.16%
GEV5/20/25$447.50$648.2544.86%
NVDA6/3/25$140.76$188.3233.79%
MIRM8/7/2025$54.23$72.1733.08%
CCJ6/9/25$62.55$92.1547.32%
ORCL6/12/25$198.31$308.0155.32%
QBTS5/20/25$13.23$40.62207.03%
IONQ9/12/25$54.74$82.0949.96%
HOOD6/30/25$85.60$140.6864.35%
IREN9/9/2025$28.25$64.14127.04%

Indicators in your Inbox

Get new posts by email:
PopularMost DiscussedRecent
  • About the General Market Index (GMI)
  • Welcome to the new *and improved* Wishing Wealth
  • How to use IBD 100 and New America stocks and TC2007 to find potential rocket stocks; Market rally begins
  • The new 3x ETF’s–triple your pleasure — or pain
  • My first YouTube Vlog (video blog) Post: Sell in May and Go Away?
  • In the hospital. Will resume posting next week. Thank you for your patience.
  • How I use put options as investment insurance
  • My first YouTube Vlog (video blog) Post: Sell in May and Go Away?
  • So, Wishing Wealth Reader, Tell Us About Yourself…
  • Blog post: David, my co-presenter, brilliant colleague of 20+ years died in a freak accident on 2/18; Day 35 of $QQQ short term down-trend; 15 promising stocks to monitor
  • Blog Post: Day 35 of $QQQ short term up-trend; $QQQ has a blue dot (oversold bounce), GMI back to 5 (of 6).
  • Blog Post: Day 34 of $QQQ short term up-trend, it could end on Monday; GMI= 4 and still Green; Will indexes hold on Monday?
  • Blog Post: Day 32 of $QQQ short term up-trend; 176 US new highs, 58 lows and 68 ATHs; This daily modified Guppy chart shows $QQQ in a solid RWB up-trend.
  • Blog Post: Day 29 of $QQQ short term up-trend; Thank you for the many “likes” I received for my post about the pundits who are predicting an imminent market top. NO ONE knows what the market will do, except by chance once in a while. I explain why I think collections of winning stocks can mislead traders. Expect failed setups!
  • Blog Post: Day 26 of $QQQ short term up-trend; Nibbling at a few stocks showing strength; See daily and monthly charts of $BTSG and my analysis.

Blogroll

  • Barchart All-Time Highs
  • Blue Collar Investor
  • CNNMoney: Pre-market Futures
  • Dark Liquidity
  • Seeking Alpha
  • Stock Chartist

Recommended Reading

QQQ and TQQQ ETF Profit Machine Momentum Masters - A Roundtable Interview with Super Traders - Minervini, Ryan, Zanger & Ritchie II Alan Ellman's Selling Cash-Secured Puts: Investing to Generate Monthly Cash Flow Stock Investing For Students - a plan to get rich slowly and retire young Trade Like a Stock Market Wizard: How to Achieve Super Performance in Stocks in Any Market Exit Strategies for Covered Call Writing: Making the Most Money When Selling Stock Options Complete Encyclopedia for Covered Call Writing Wall Street The Other Las Vegas How to Make Money in Stocks: A Winning System in Good Times and Bad, Fourth Edition Trend Trading: A seven step approach to success How Legendary Traders Made Millions: Profiting From the Investment Strategies of the Gretest Traders of All time The Complete TurtleTrader: The Legend, the Lessons, the Results How to Make Money Selling Stocks Short Reminiscences of a Stock Operator Stan Weinstein's Secrets For Profiting in Bull and Bear Markets Lessons from the Greatest Stock Traders of All Time How I Made $2,000,000 In The Stock Market

Archives

© 2025 WishingWealthBlog.com
 

Loading Comments...