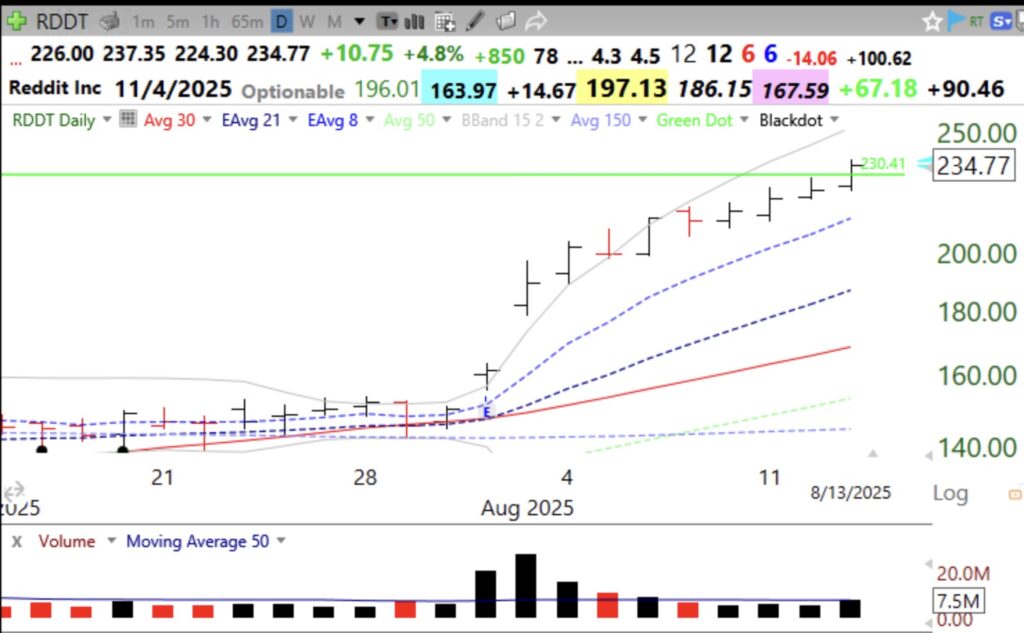
Daily chart. RDDT began ths rise with a gap up after earnings. I would like to see more volume on today’s GLB. A CLOSE below the green line at 230.41 would be a failed GLB.
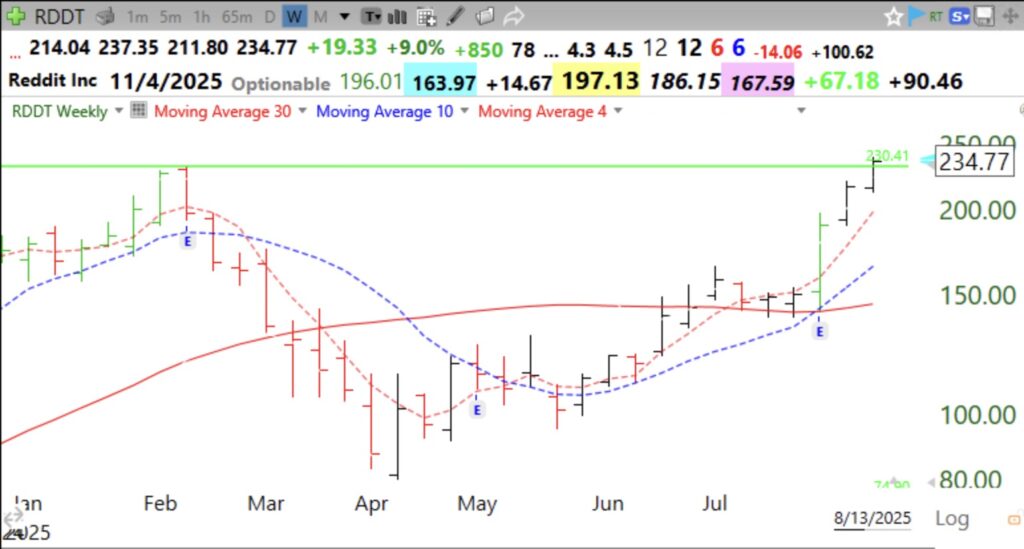
Weekly chart. Note moves after each quarterly earnings report is released.
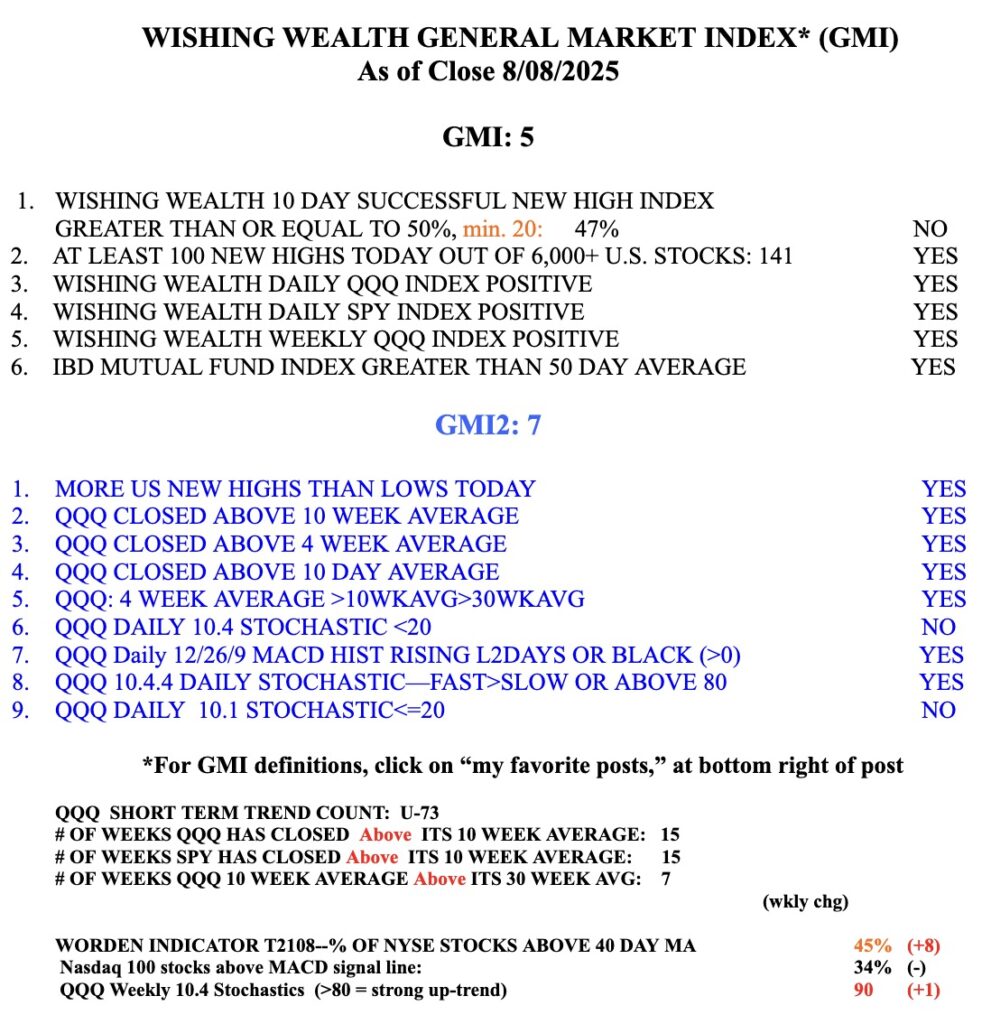
Stock Market Technical Indicators & Analysis
Daily chart. RDDT began ths rise with a gap up after earnings. I would like to see more volume on today’s GLB. A CLOSE below the green line at 230.41 would be a failed GLB.
Weekly chart. Note moves after each quarterly earnings report is released.
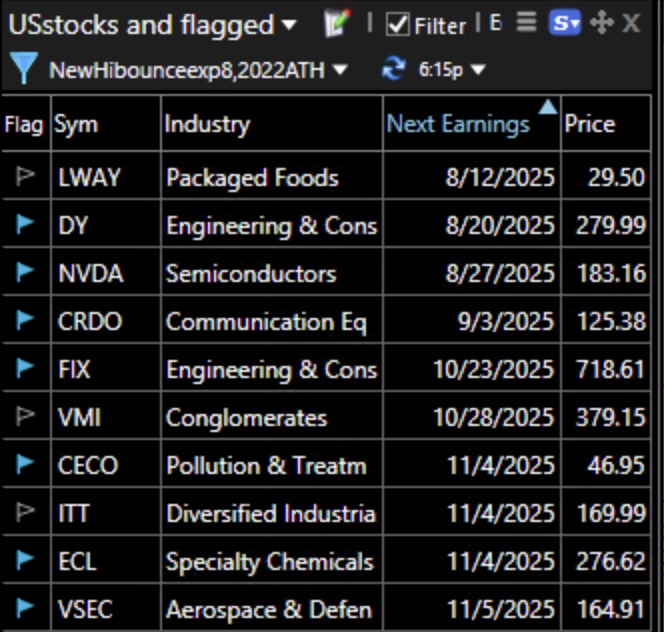
If I bought one of these I would sell with a close below the 8 EMA.They are sorted by earnings date. I explained this setup during my recent TraderLion appearance.
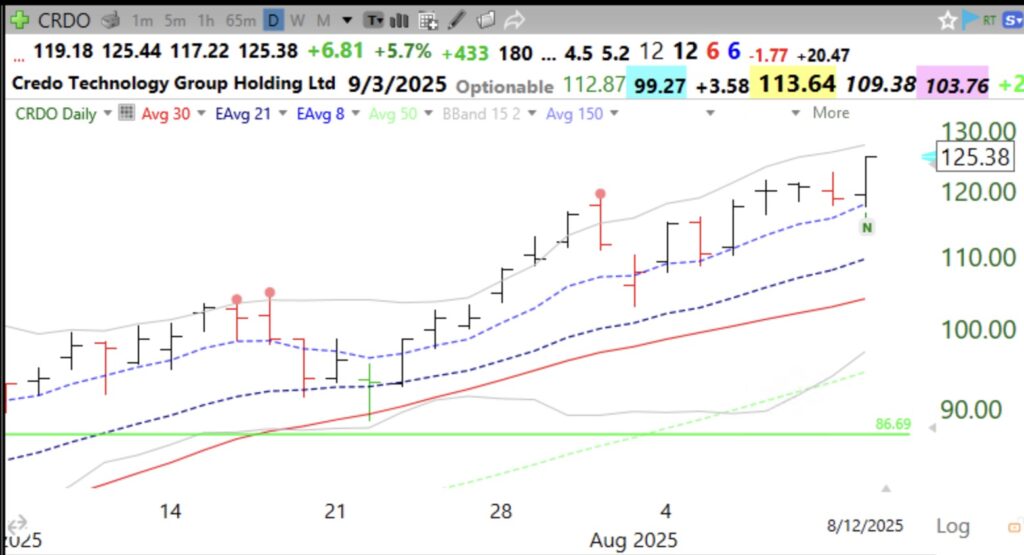
CRDO is a fine example of this setup. It is above the last green line and has been tracking its 8 EMA. IBD Comp=99 with estimated earnings up tripe digits. It has already advanced more than 4x from last year.
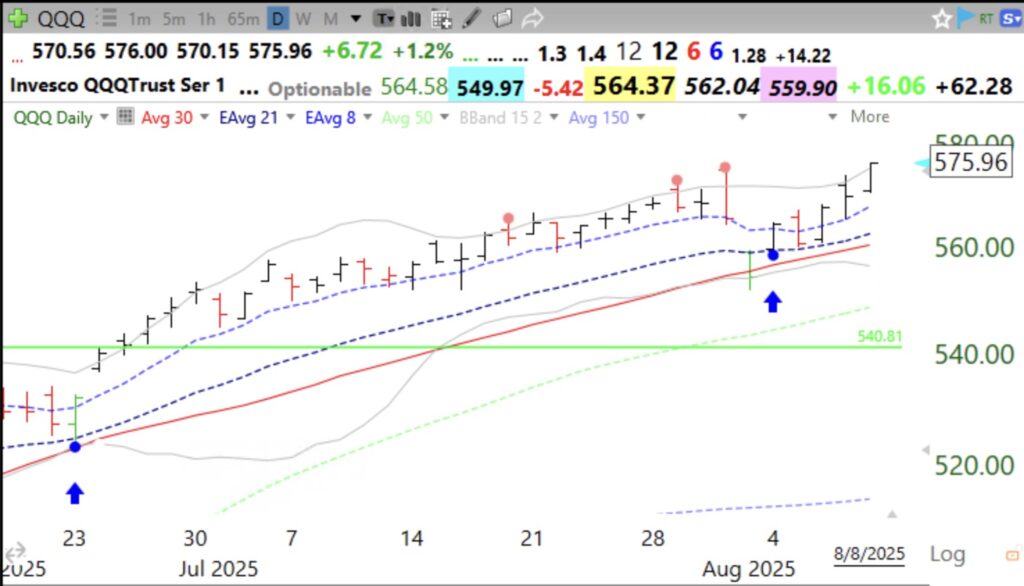
Given that I am a chicken, I sometimes follow my emotions rather than my rules. I tell you when my actions work and when they do not. Given the reversal of QQQ on heavy volume from all-time highs (red dot) on 7/31 and the subsequent high volume decline on 8/1, I exited my positions in my trading account even though my stop losses had not been tripped- a huge mistake because many of my stocks held up. However, when the market bounced and had a Blue Dot oversold bounce signal, I slowly bought back in. Please remember that I am a chicken in my trading accounts. However, I rarely exit my mutual funds in my university retirement accounts, only when the longer term signals I frequently post about turn down. We are not near that type of signal.
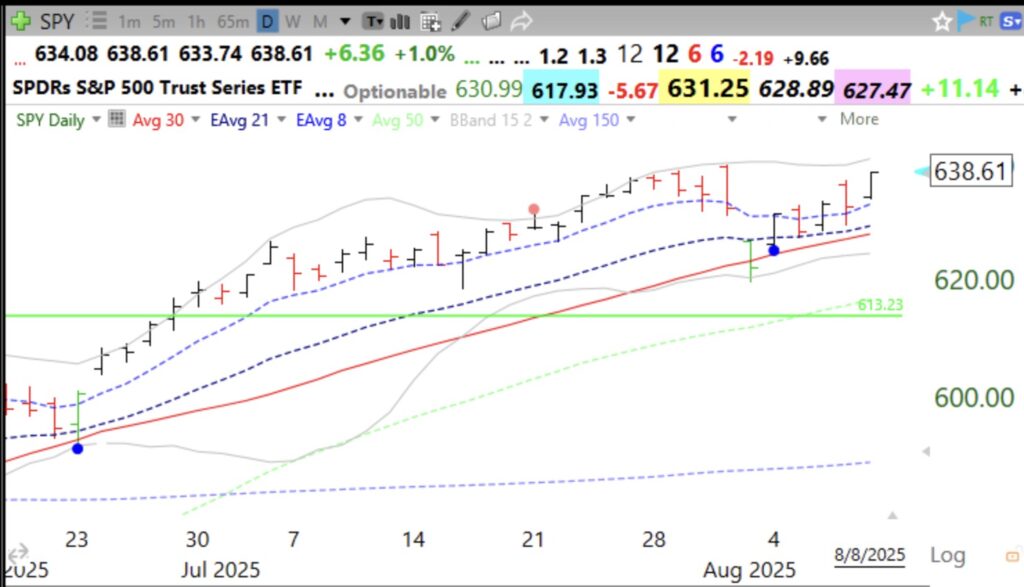
So here is the daily chart of the QQQ with its blue dot signals. Spy also has a similar pattern. The key to trading successfully is to be able to reverse one’s positions when new signals arrive. Many small losses and a few large gains is what I strive to achieve. With the QQQ short term trend count at 73, I expect an end of the current up-trend might occur at any time. On Friday there were 141 yearly highs and 50 all-time highs, but only 46% of the 6200 US stocks rose. However, 65% of the Nasdaq 100 stocks rose. Thus, the strength has occurred primarily among the tech and growth stocks represented by the QQQ. One of the components in my GMI, 10 day Successful New Highs among the 6200 US stocks is only 47% and has been below 50% since 7/29. This means that the majority of US stocks that reached a 52 week high 10 days ago are not higher 10 days afterwards. Break-outs are failing. So I always have one foot out the door in my trading accounts. All of my positions have stop losses and I do not have to be glued to the monitor each day. Stop losses are accurately named. They stop my losses. They are the sine qua non of trading. I studied Latin for 6 years at Boston Latin School. I explained my Blue Dot of Happiness setup in my recent presentation at day 6 of the TraderLion Annual Conference 25. Check out the free recordings for Day 6. As you may recall, Richard Moglen, the leader of the conference is my former illustrious student.