My trading account had the best week in quite a long time! I moved some funds back into an S&P500 mutual fund in my university pension and began buying stocks. I bought some dividend paying stocks as well as promising growth stocks. Most of my purchases have had recent green line break-outs (GLB) to an all-time high. However, I wanted to write about two positions I hold in stocks that are approaching, but not above, their green line tops. The first is MXL, which I believe had a cup and handle break out last week. The break-out came on above average trading volume. I started a position and will go in much more if MXL can close above its all-time top at 19.50, made in 2010. I usually wait for the GLB, but its fundamental and technical strength tempted me to move early. If MXL closes below its pivot break-out line, around 18.18, I will begin to exit the trade. MXL has very strong IBD stats.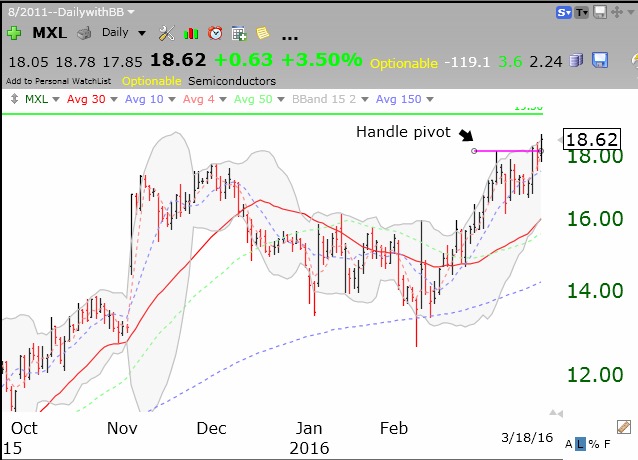 The second stock I have been buying is SQ. It is a recent (11/2015) IPO and my former Apple Genius son and webmaster told me that SQ has a great product for small business owners. My son helps people in the DC metro area to learn how to operate their Apple products. Even technically challenged persons can use the Square square. They make that small square card reader that even Boomer business owners can attach to their phones and accept charge card payments. I bought SQ after I noticed that the stock held up at the bottom line in the chart even when the market had a few large down days in February. About a week after I bought some, Visa announced that they had taken a 10% stake in SQ, a very nice surprise! If SQ can close above its green line top at 14.78 I will aggressively accumulate it.
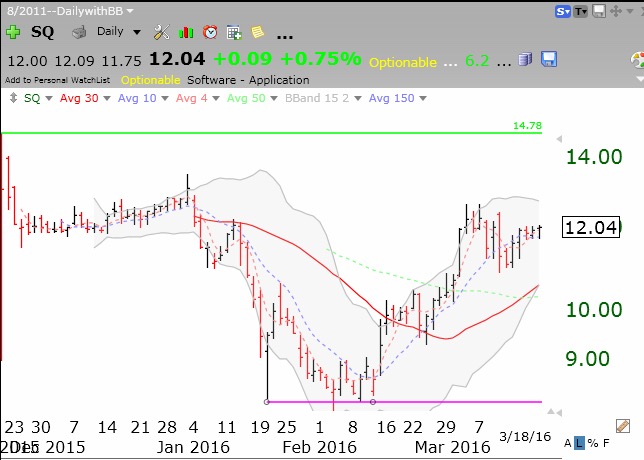
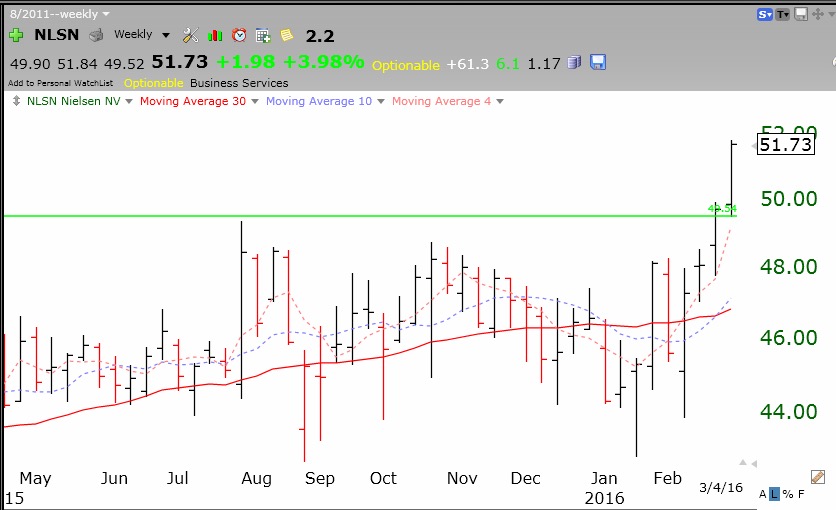
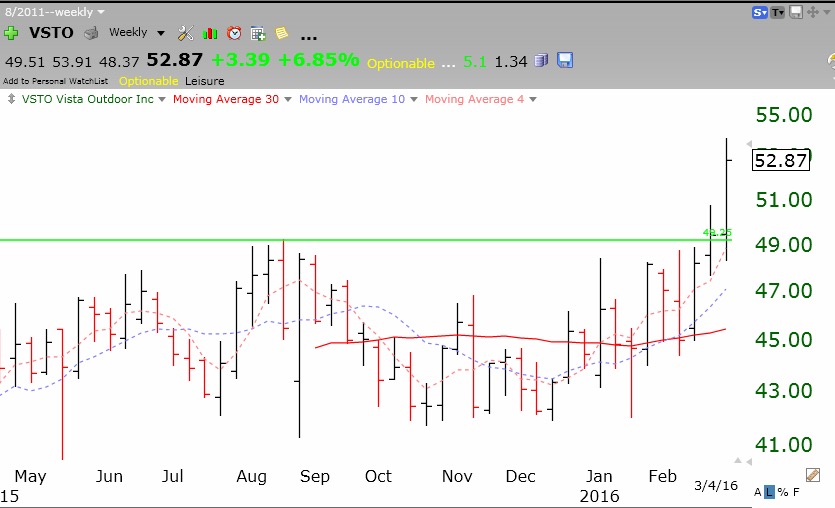
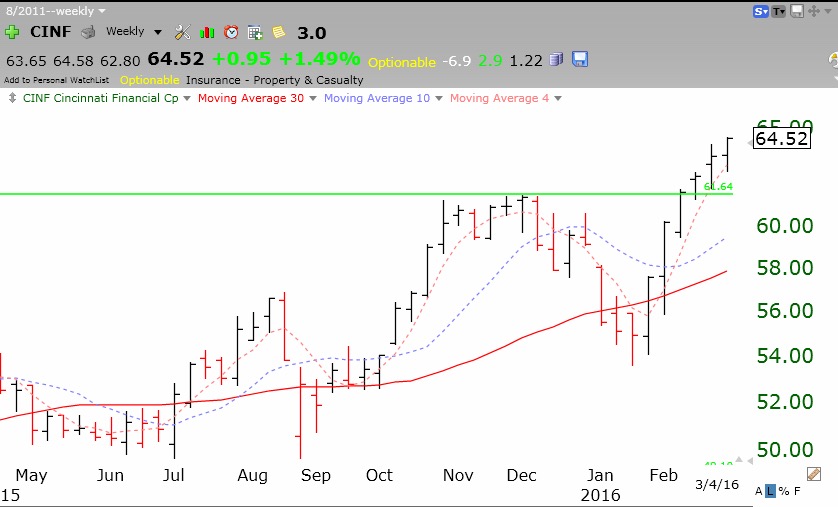
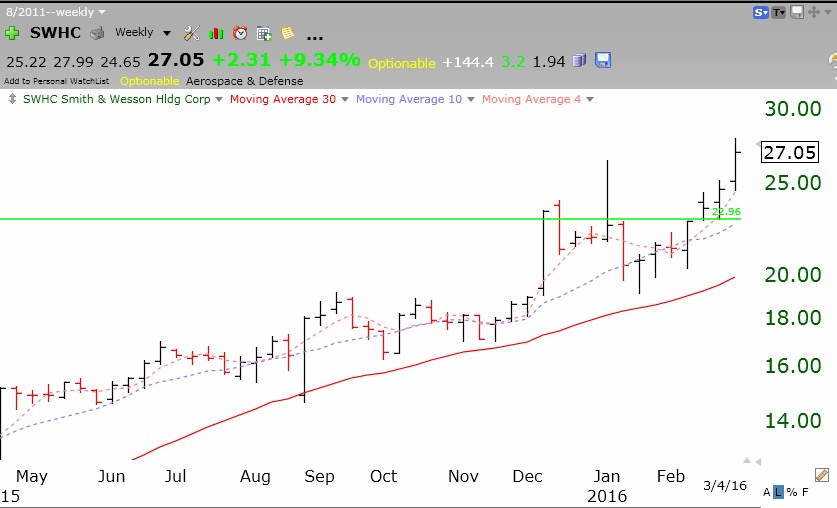
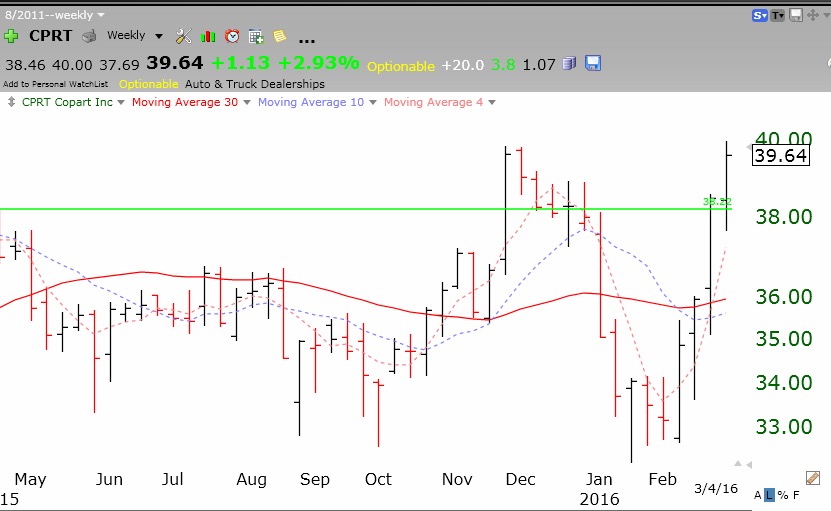
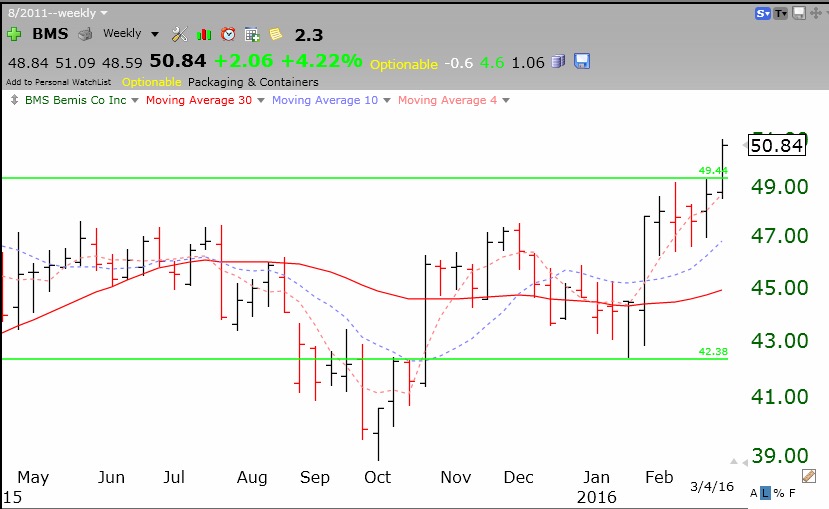
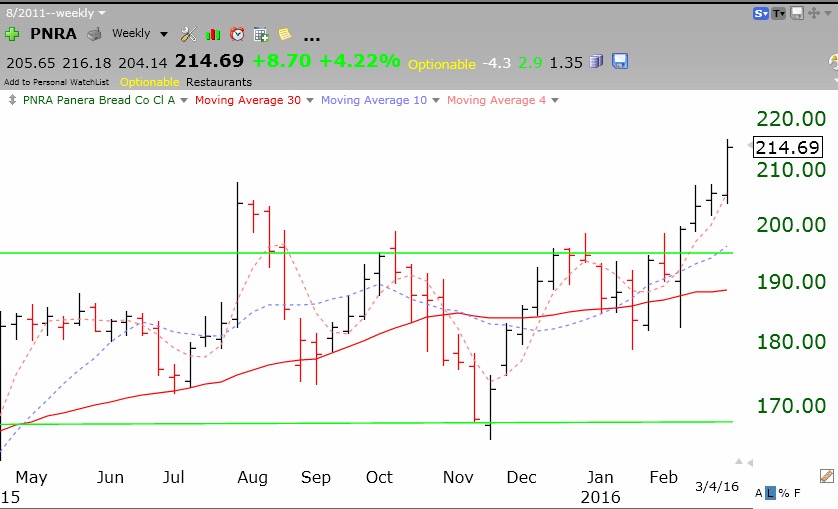
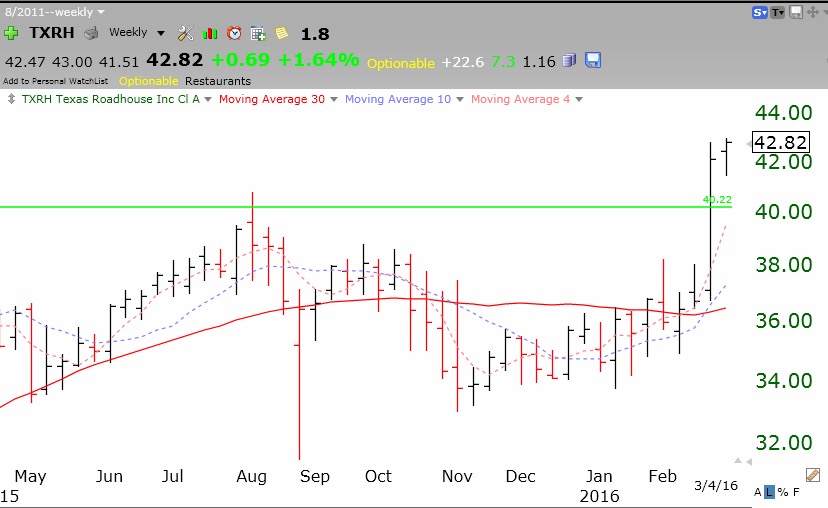
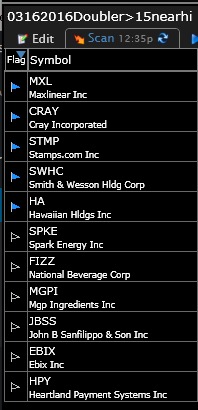
 Here are the results of my TC2000 scan for stocks that have doubled the past year, are near their yearly highs and have a strong long term monthly RWB pattern.The top 5 with a blue flag to the left appeared in one of my many IBD lists of noteworthy stocks. Like the great trader, Nicolas Darvas, I like to buy stocks that have already doubled and are trading near their all-time highs. These stocks are for educational purposes and research only. Everyone needs to use his/her personal set-up for timing purchases and managing risk. Only a few are GLB stocks. Guess which!
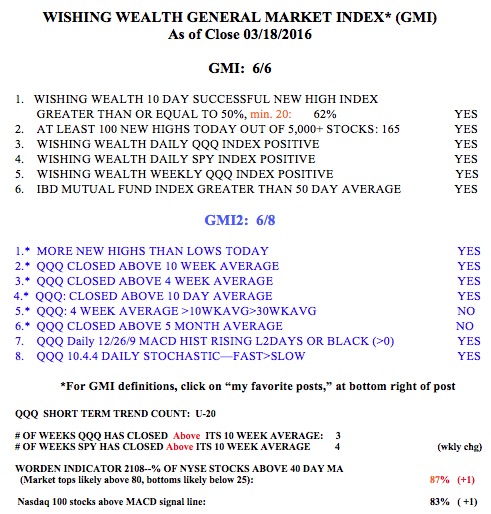
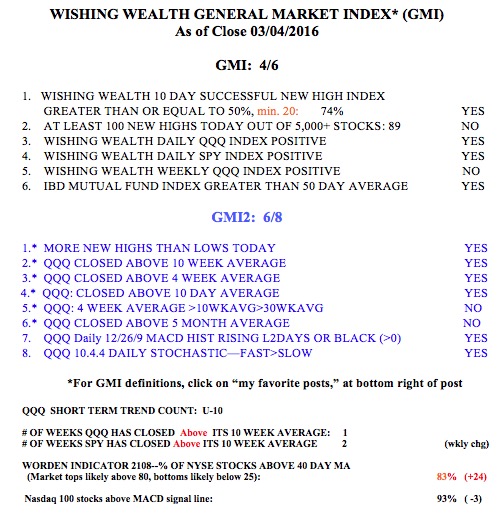
The GMI remains at 6 (of 6). I am glad there are so many media pundits skeptical of this advance. The market climbs a wall of worry. I am riding this rise until my indicators tell me to get out. Get my posts as tweets: @WishingWealth