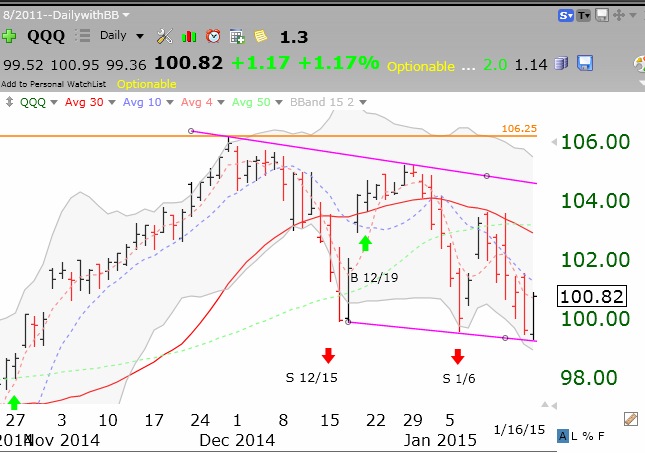
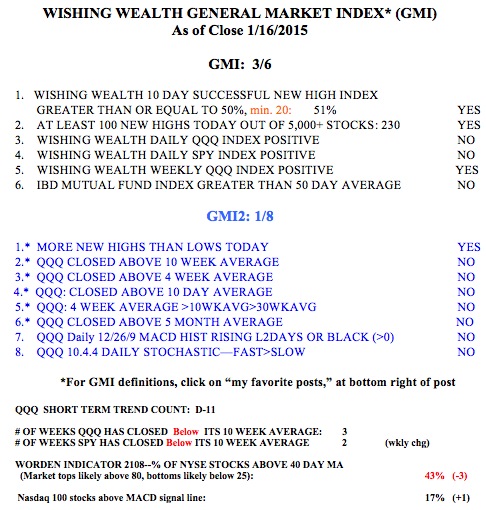
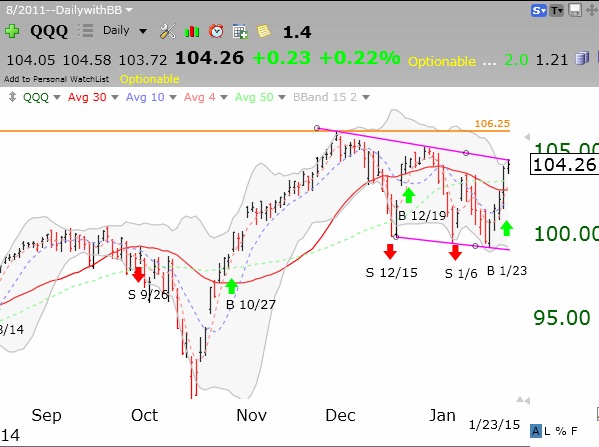
Every once in a while my technical indicators point one way and my gut to another. While I have never systematically analysed how often which way was correct, I suspect it was my instruments. The market tends to move in a direction opposite to the way my emotions point. This may be one of those times. The GMI has signaled a new Buy as of Friday’s close and my QQQ short term trend indicator has also turned up (U-1). I just find it difficult to believe that this up-trend will last longer than a day or so. The last few GMI buy signals occurred within a short bounce only to have each end and reverse in about 5-7 days. The QQQ is now right at the top of its recent channel (see daily chart below) and could reverse down again very quickly. Or will the QQQ begin a major leg up? And there are so many rational reasons to expect a market decline: Greek election results, deflationary effects of cheap oil, too strong a U.S. dollar, post earnings release lull on the horizon, to name a few. And technically the major indexes are diverging, with the SPY still below its 10 week average even as the QQQ climbs above this critical average. Clearly, tech stocks are outperforming the large cap industrial sector that might be hurt by some of these things I mentioned. So, what to do? Follow my instruments or my gut? My intellect and some of my trading gurus have opined that when one does not know what to do one should lay low until the dust settles. So I will not make major trading decisions today. I will hold my long positions, mainly concentrated in a few strong bio-techs, and will cut back or eliminate my SQQQ and buy a little TQQQ if Monday looks strong.
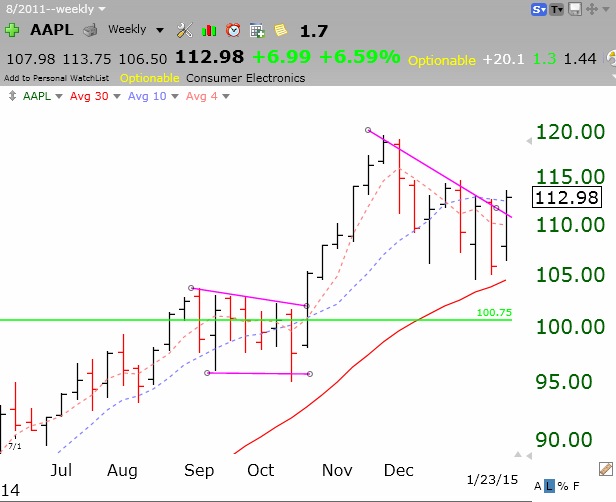
 One reason the QQQ appears strong is that AAPL has regained its 10 week average (blue dotted line). I have always profited by owning AAPL when it is above this average. AAPL reports earnings this week and will have a large impact on whether the QQQ holds.
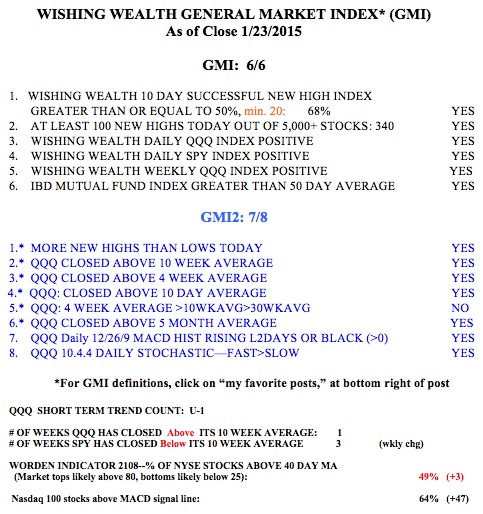
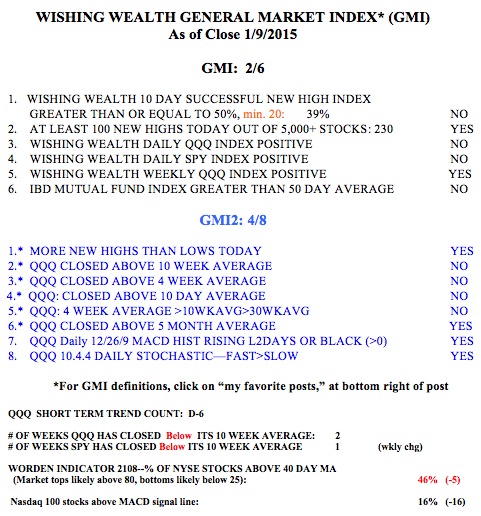
 The GMI is now at 6 (of 6).