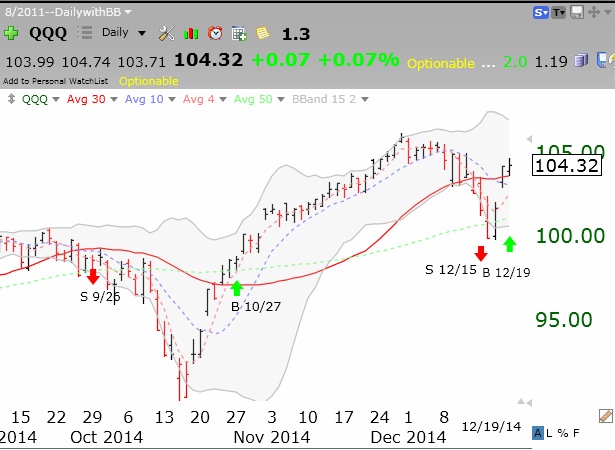
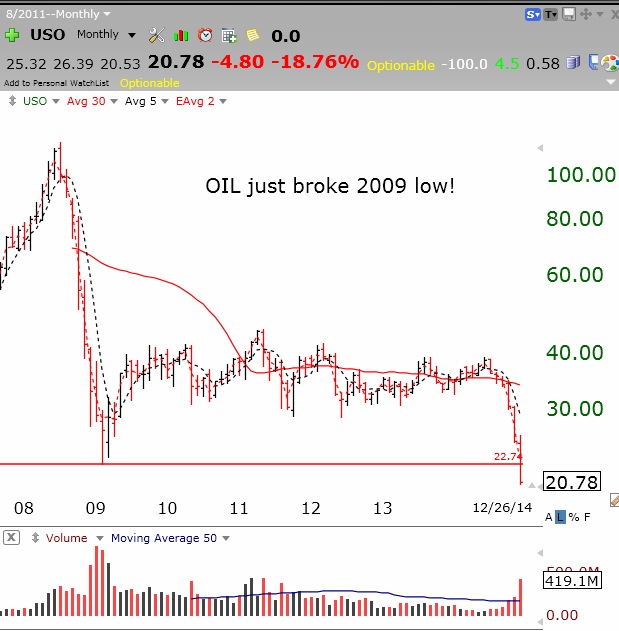
One of my students made a small fortune the next year after taking my honors course by shorting (buying put options) USO during oil’s collapse in 2008. I took a look at the chart of USO, an oil commodity ETF, and was surprised to see that USO has now closed below the level of its bottom reached in early 2009. Take a look at this monthly chart. December’s trading volume thus far is a lot less than the monthly volume at the 2009 low. (Note that the TC2000 monthly bar only presents the cumulative total since the beginning of the month, so it underestimates December’s full month volume.)
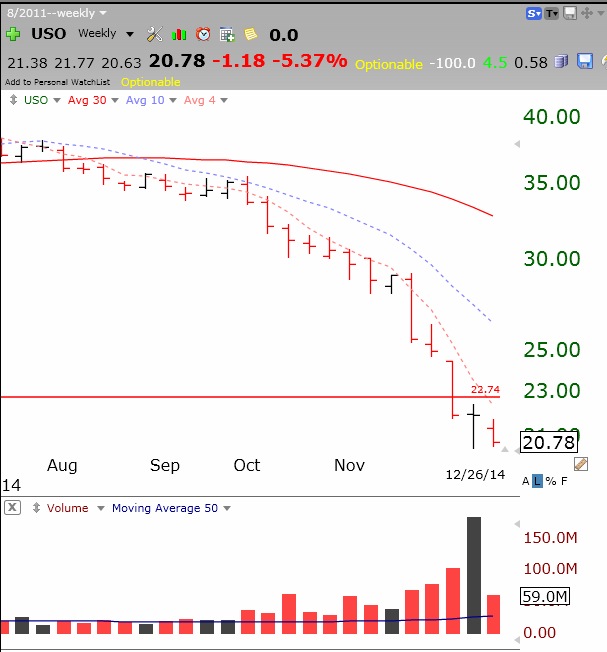
This weekly chart of USO shows more clearly what has happened recently. Two weeks ago there was a large volume bounce up of USO after a near vertical multi-week drop, and it closed that week near the top of its weekly price range. Notice that that bounce came on the largest weekly trading volume in months. More significant, note that last week USO gave back most of the bounce. Given that USO has closed below the 2008 bottom after a 4 year side-ways consolidation, this could mean that USO (and oil) may have a long way down to go?? What would that do to the bullish market scenario for 2015 embraced by so many…….. (By the way, all of the other oil-related commodity ETFs I checked had the same price pattern.)
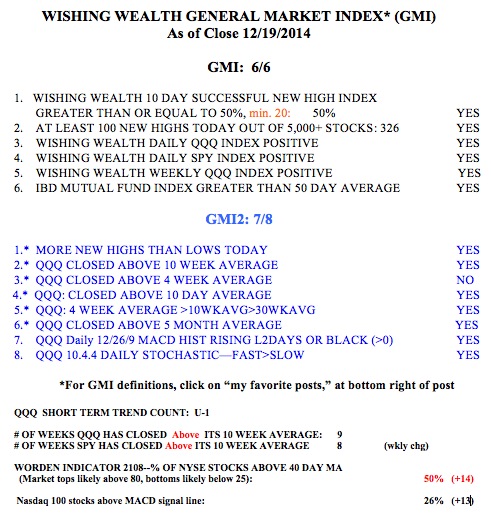
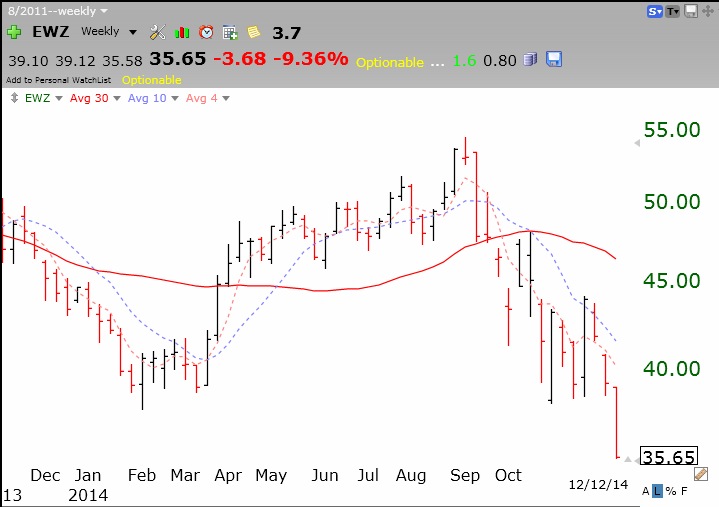
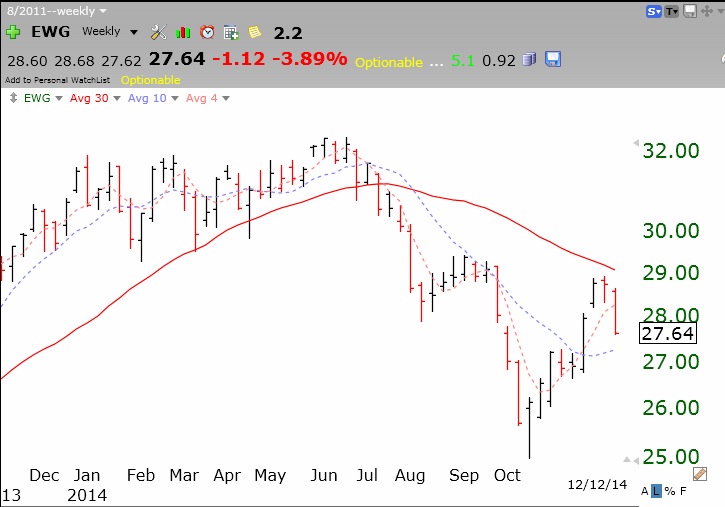
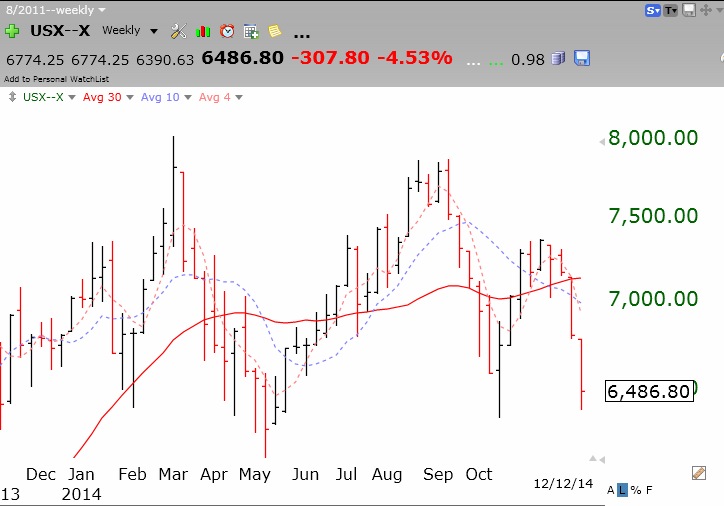
 Meanwhile the GMI remains at a full 6 (of 6).
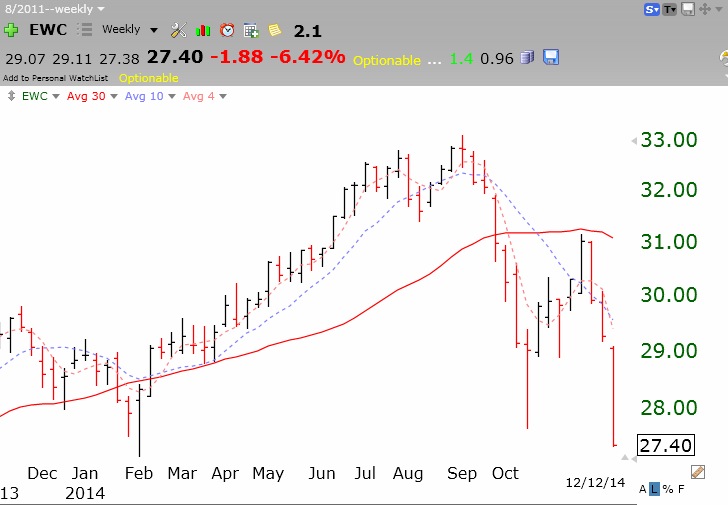
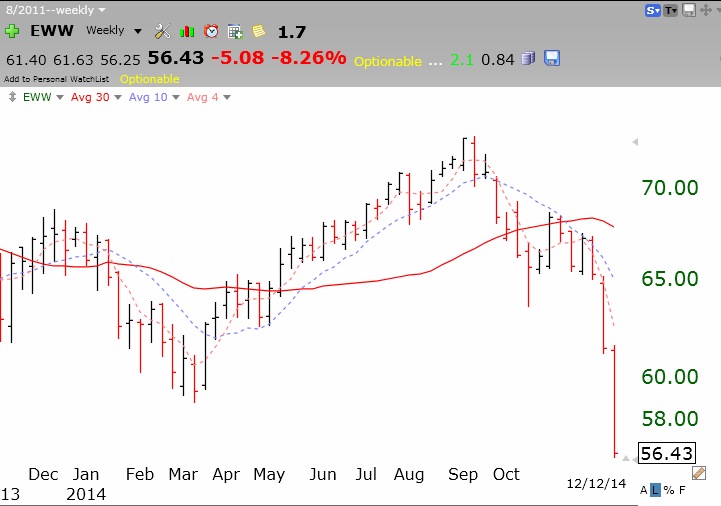