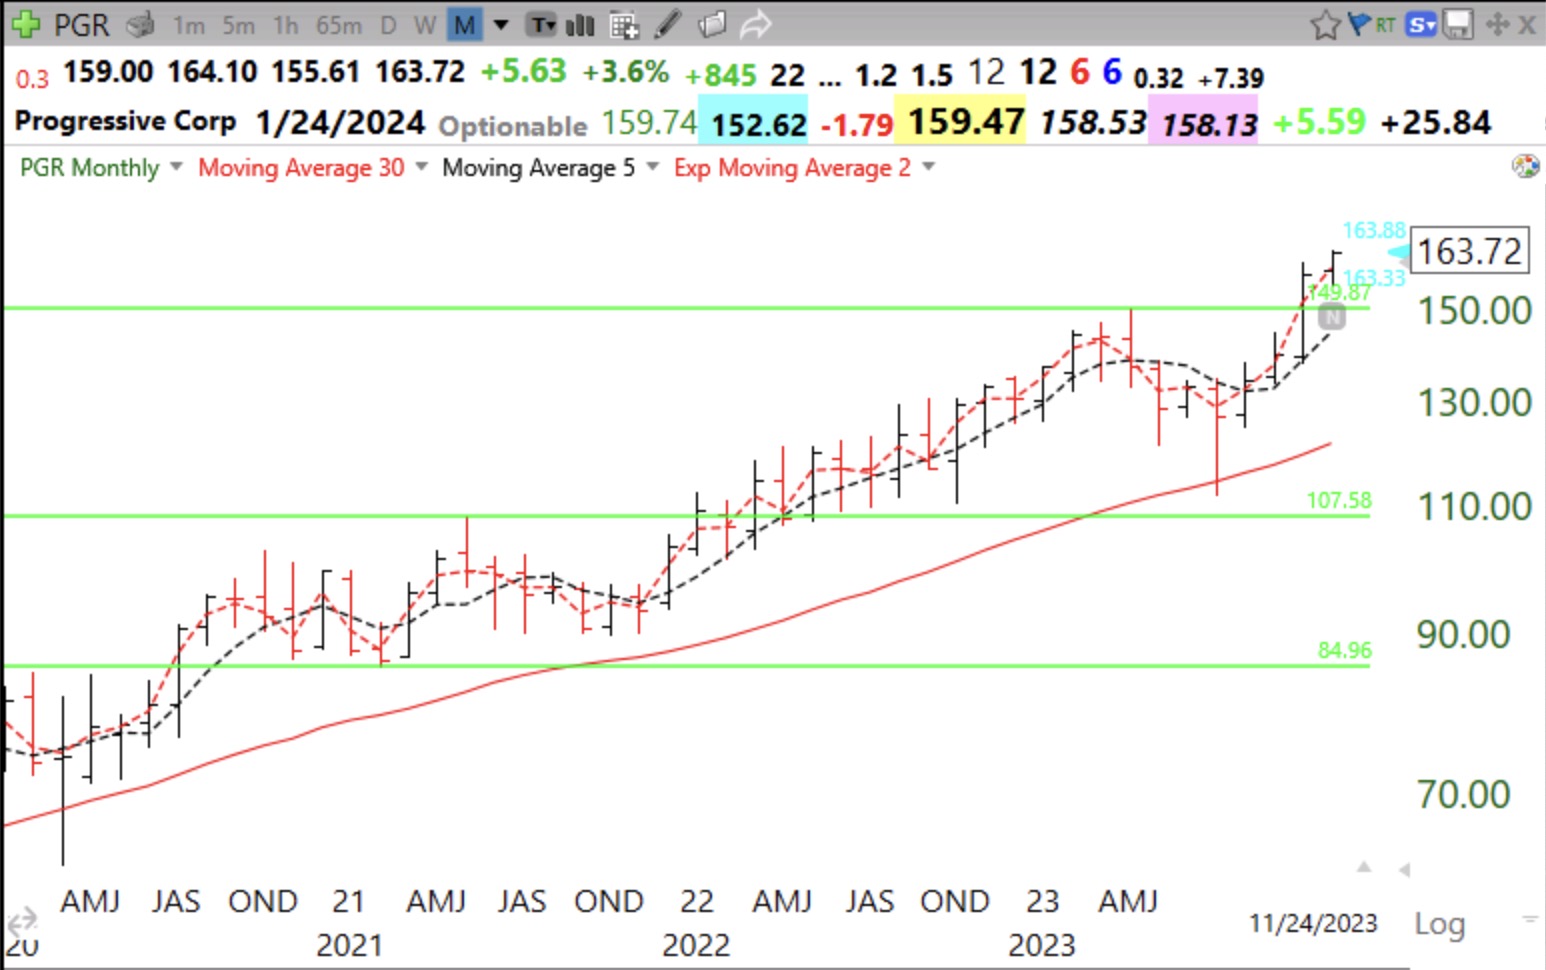
The leading successful stocks bought by such greats as Nicolas Darvas, William O’Neil and others are those that go on to a series of all-time highs. These traders tended to buy when a stock hit an ATH, consolidated, and then broke out to a new ATH. That is the idea behind my green line breakout (GLB) setup. I draw a green line on a monthly chart at the price bar during which an ATH was reached that was not exceeded for at least 3 months (bars).
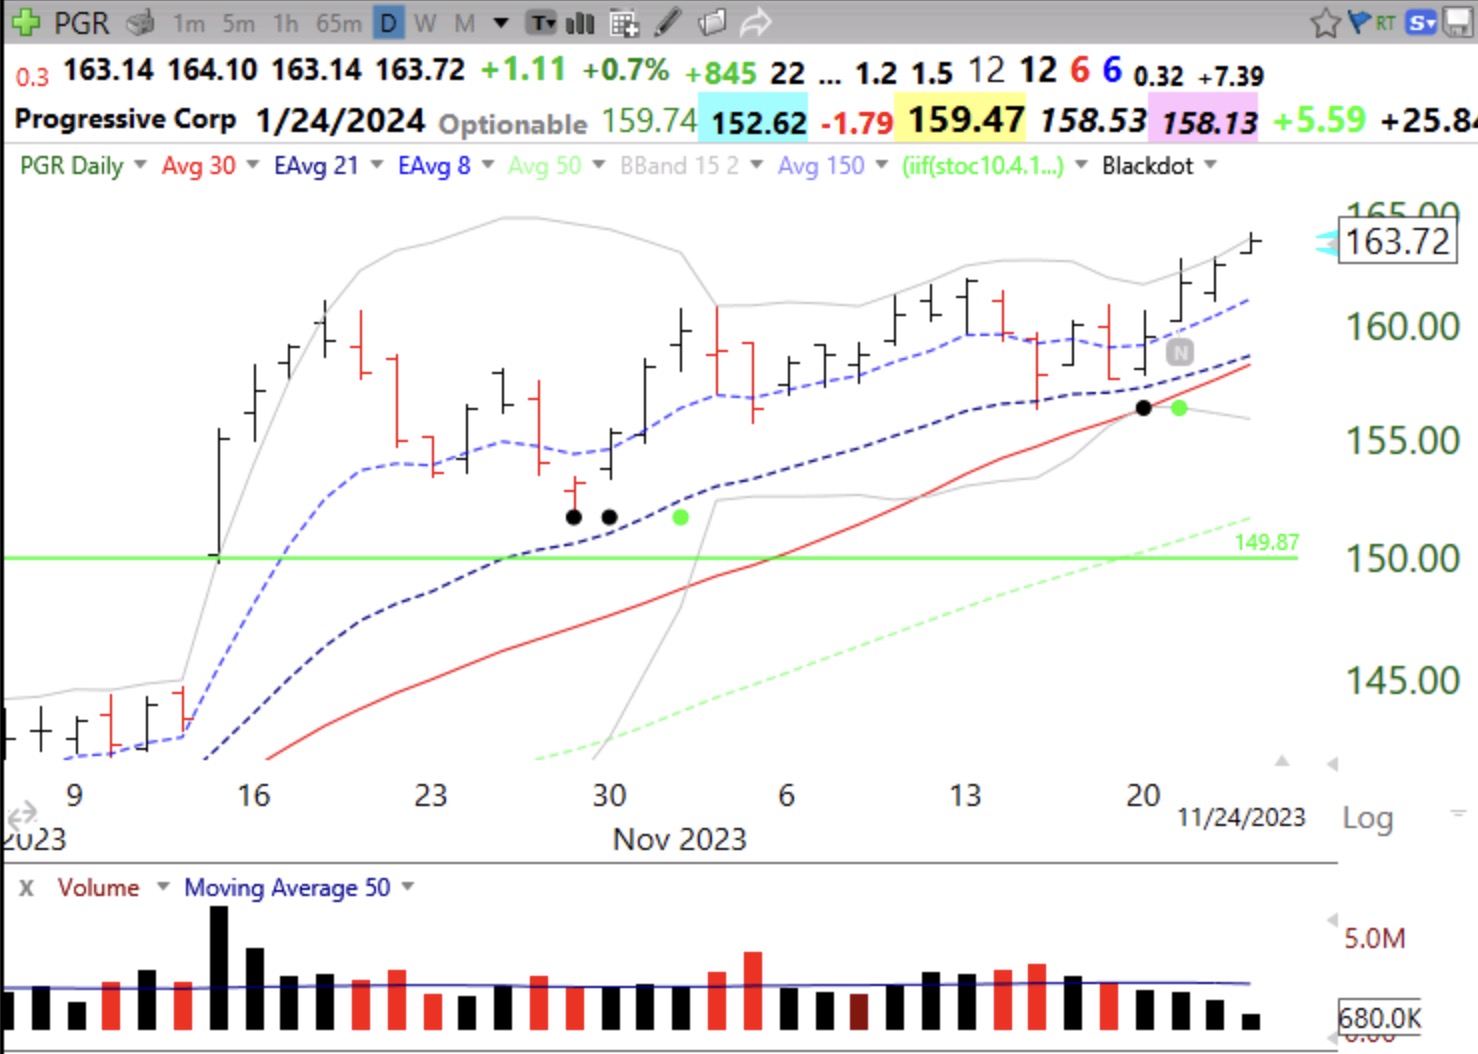
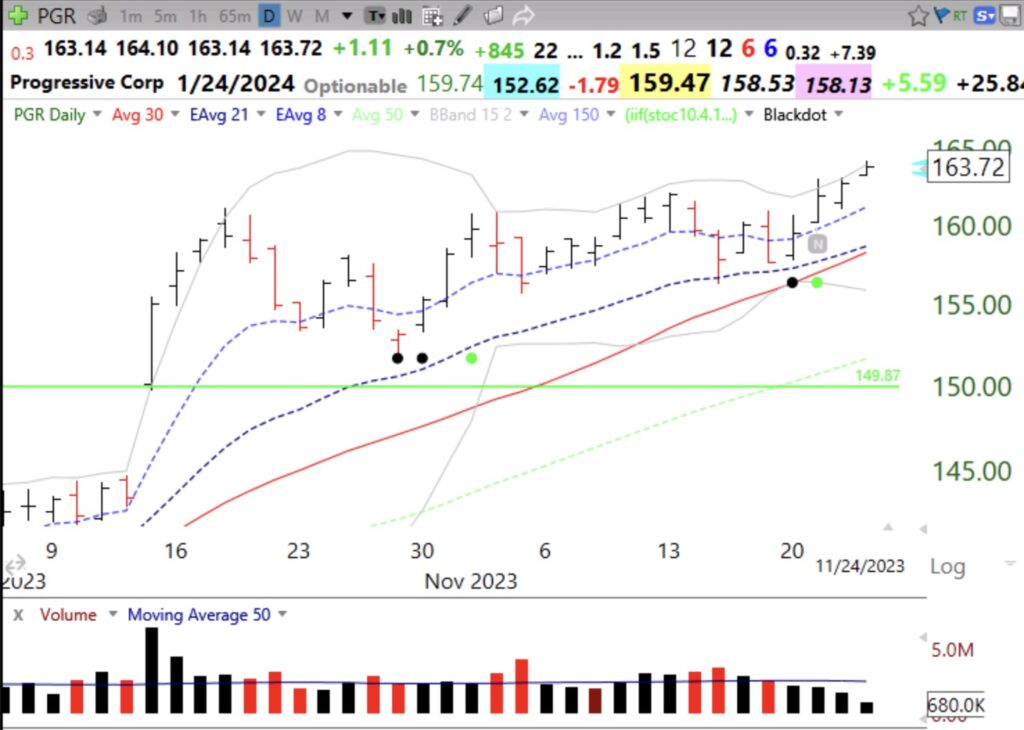
Look at this monthly chart of PHR. In April, PHR reached an ATH= 149.87 that was not surpassed for at least 3 months. That is where I drew the green line and set an alert in TC2000 to tell me when/if it ever trades above that green line. The daily chart below shows that PGR had a GLB on October 13 on unusually heavy volume, a good confirmatory sign. PHR never closed back below its green line (which would be a failed GLB) and closed Friday at 163.72, up +9.2% from the green line. PGR has an IBD/MS Composite rating=96. I always check out IBD/MS fundamental ratings before buying. I want to buy advancing stocks that have great fundamentals.
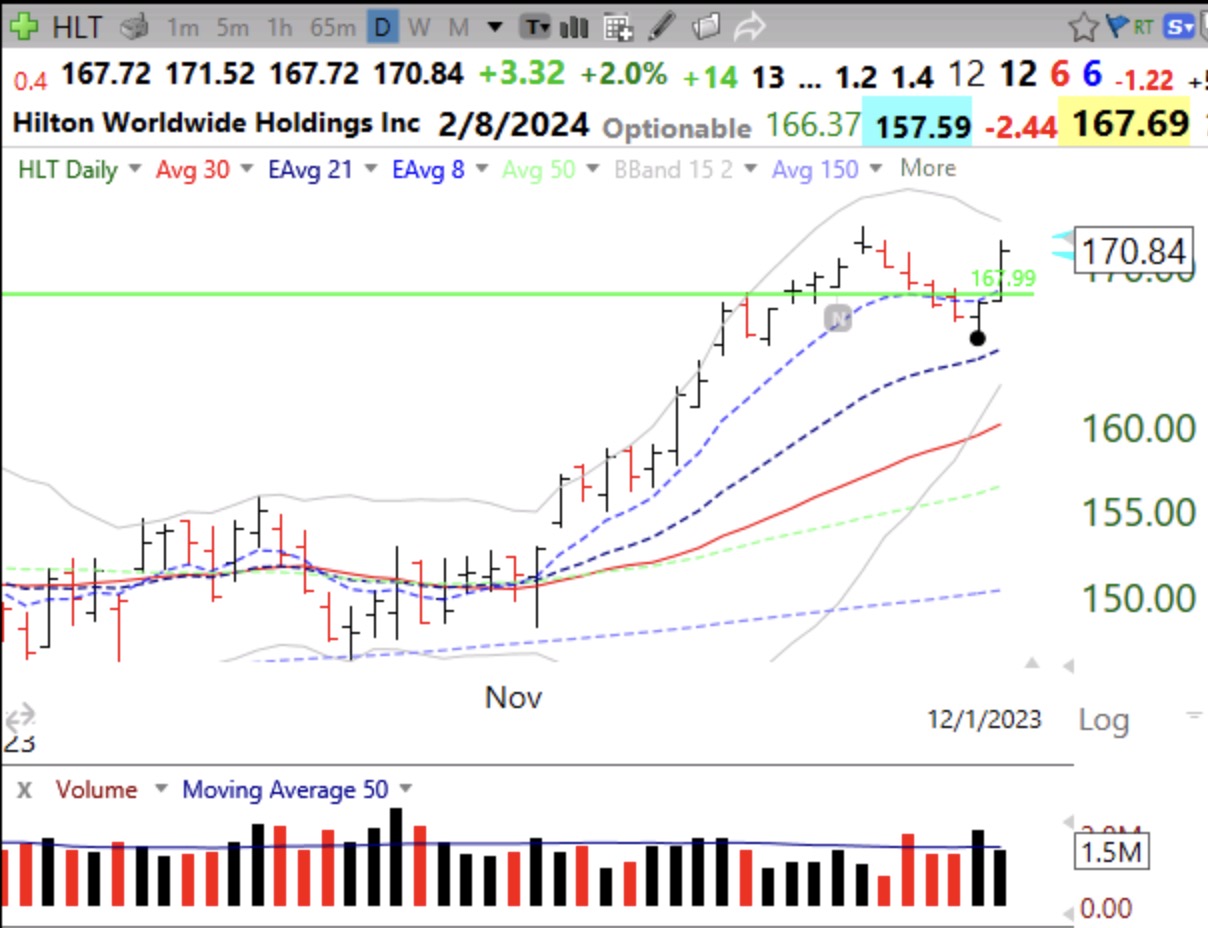
Buying GLBs can be very profitable during market up-trends, but most people think it is better to buy stocks at lows–WRONG!!! I buy high and sell higher. We want to hitch a ride on the way to the moon. Other stocks I have noticed that recently have had a GLB are: CMG, MSFT, DUOL, MPTI, QLYS, HLT, CAH, CRH, WING, RACE, V, COR, AIR, ITT, L, CNM. Check them out. Why bottom fish or buy stocks way down from their ATHs when there are so many rockets taking off to ATHs and to the moon. It takes a rocket scientist! Once I buy a GLB, I sell immediately if it closes back below the green line. If I miss the day of the GLB, I will buy it afterwards if it exhibits another of my entry setups. I only buy stocks trading above their last green line tops!

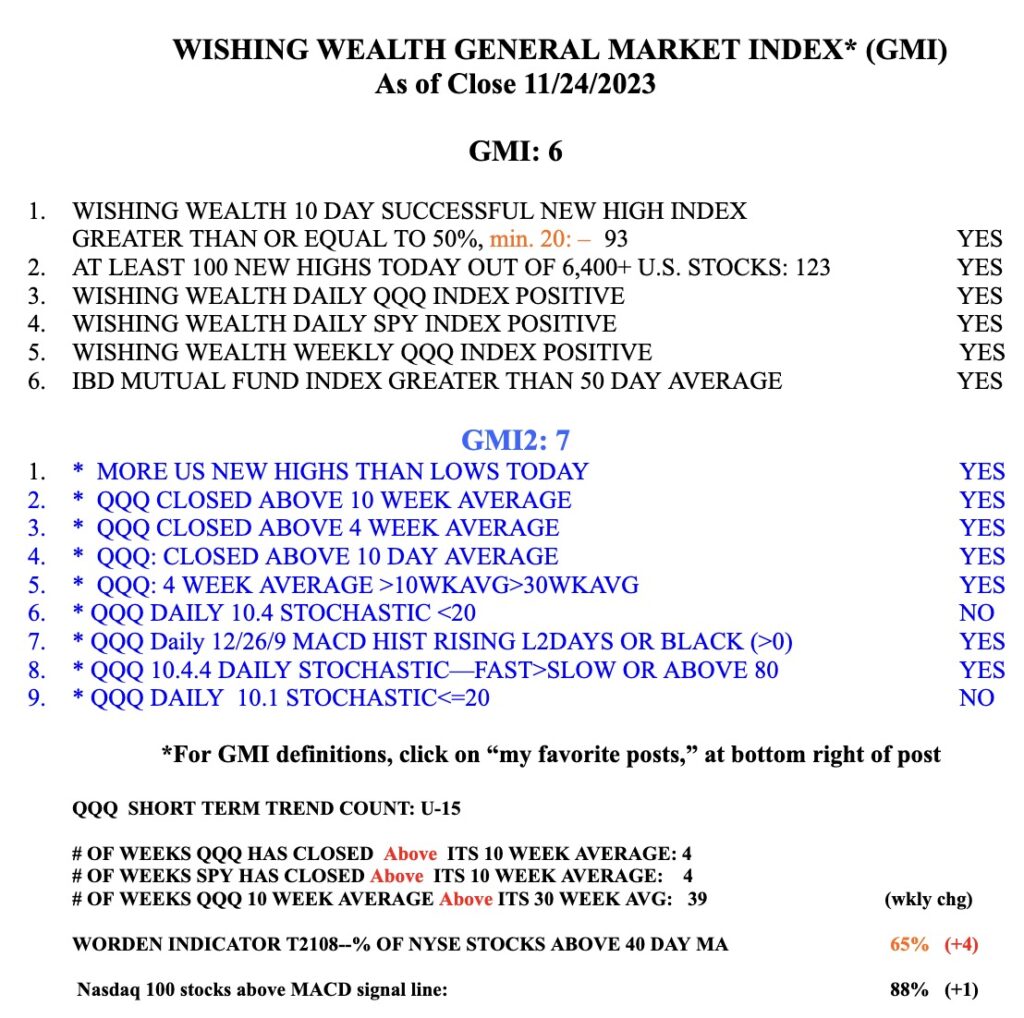
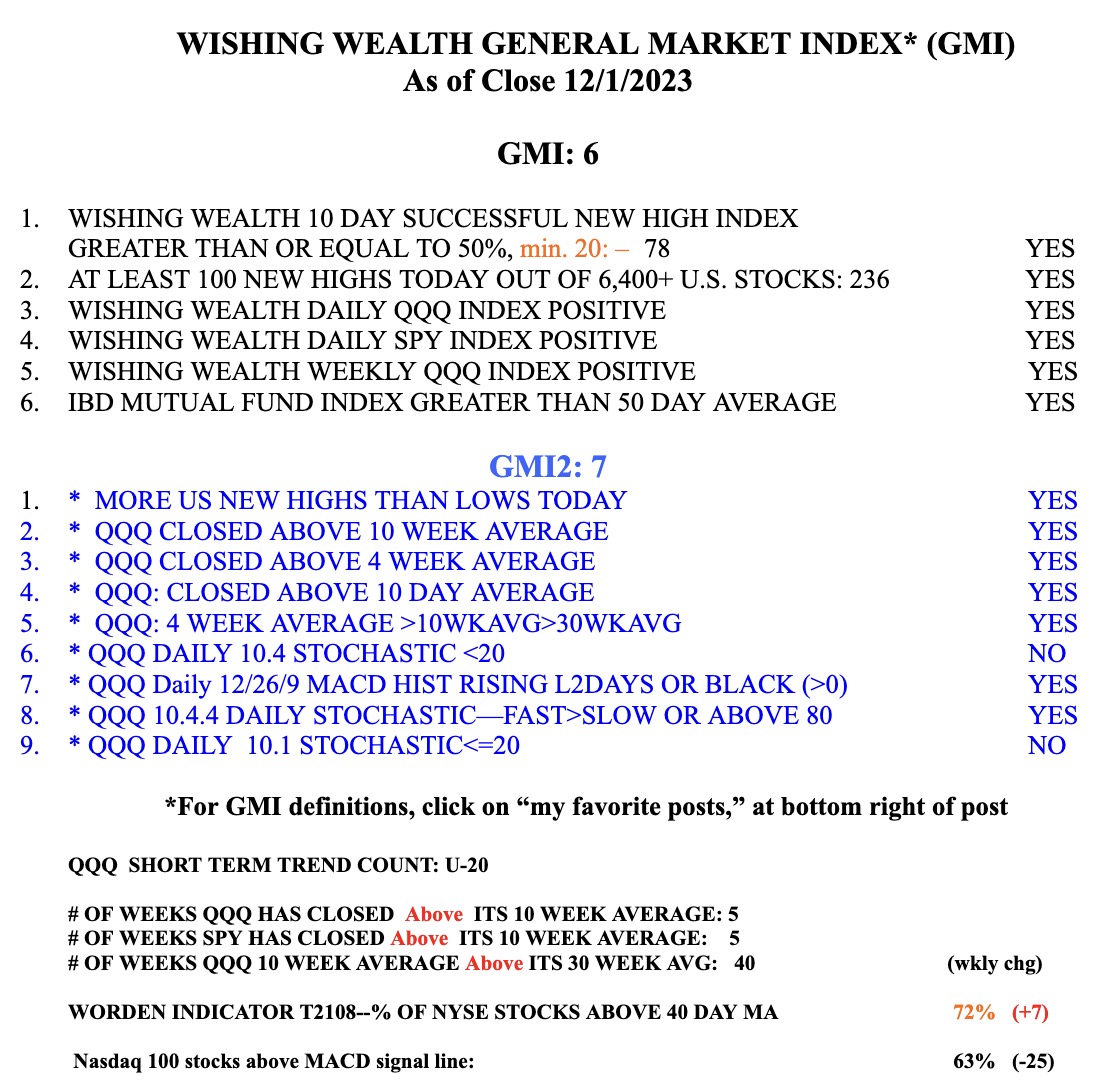
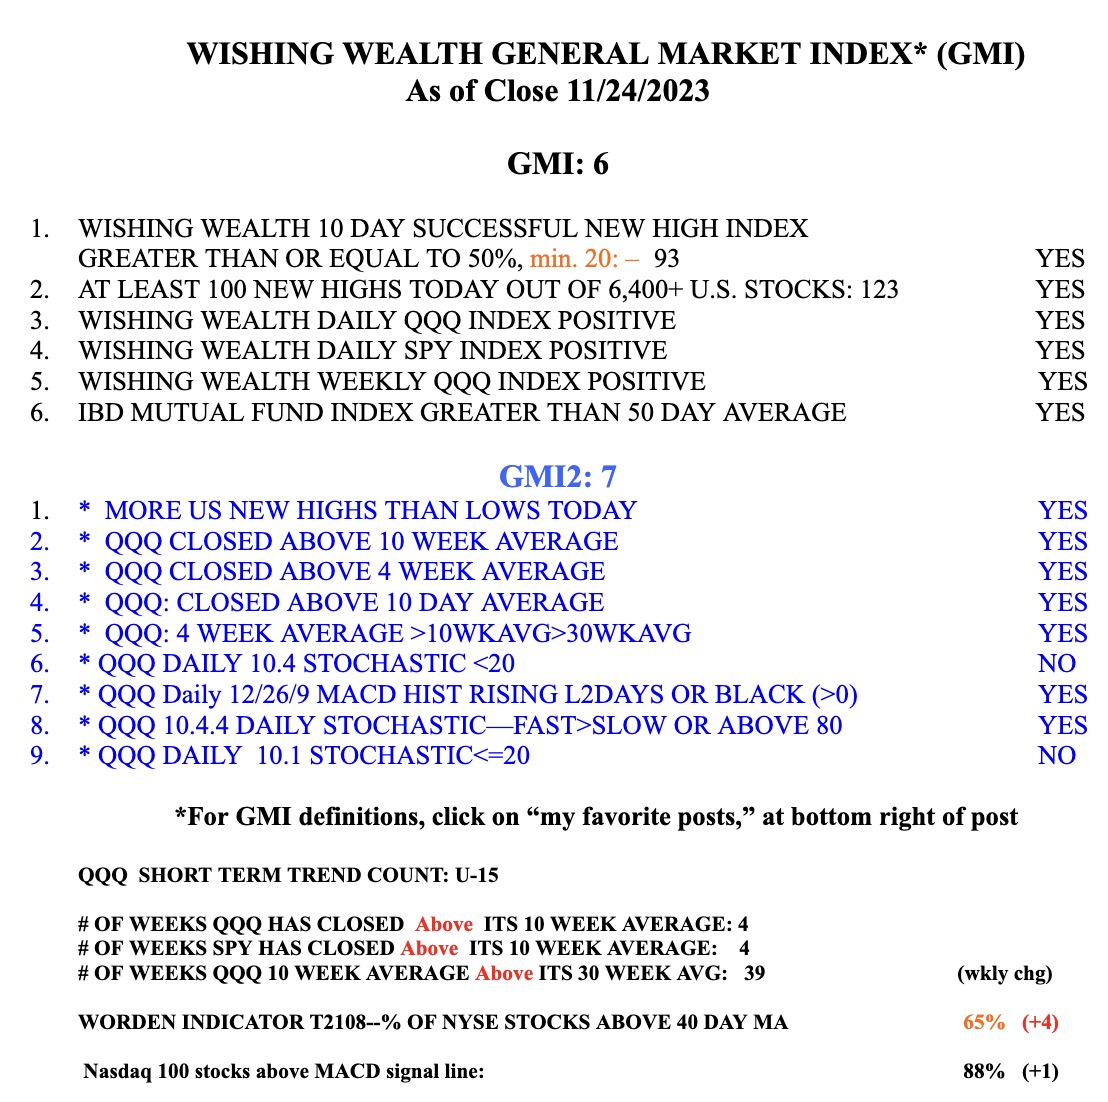
The GMI= 6 (of 6) and Green. Time for me to be invested long.