Darvas anticipated; GMI: +4; GMI-S: 31; Ominous market

“The best work I ever did in judging the market was when I devoted one hour a day in the   middle of each session.   I did not come to Wall Street.   I had no news ticker.   I seldom read the news items but judged solely from the action of the market itself; hence I was not influenced by any of the rumors, gossip, information or misinformation with which the Street is deluged day after day.   The out of town investor is not under as much of a handicap as he might suppose.   If he is trading and can get the result of the day’s operation in time to give his orders next morning, he is better off than the majority of people who come down here and hang over the ticker.   His opinions are formed from the facts.   He must know how to assemble these and draw the proper conclusions.   But all he needs is the highest, lowest and last prices of these stocks he is watching.   Without at all being egotistical, I believe I could go around the world and having arranged to have these few details of a stock like U.S. Steel or any other active issue cabled to me daily, I could cable my orders and come back with a profit.   It would not be necessary for me to be advised of the volume of trading in that stock or the general market, although in some instances this might help.   Certainly I would not care to have any news of any kind included in the cables.”

How I Trade in Stocks and Bonds, Richard D. Wyckoff, 1924

Richard Wyckoff, the famous trader and Wall Street editor, anticipated the very feats of Nicolas Darvas thirty years later, when Darvas made his fortune trading stocks as he danced around the world far from Wall Street.   Darvas literally received end of day price quotes cabled from his broker in New York.   When he received his weekly copy of Barron’s, he tore out all of the news and opinion pages and looked only at the stock prices.   During this period of intense insulation from outside opinion and the media, Darvas said he could clearly interpret price patterns.   When he began to make money trading and came to NYC to camp out in the Plaza Hotel to be close to the action, he lost his ability to trade.   Only when he left the country and focused again only on prices did his judgment and trading success return. (Darvas’ incredible story is told in his two books cited to the right.)

So what does all this mean for us today?   I am glad to be freed up from needing to talk to a broker to place my trades.   In my youth, selling a stock that I was losing money on was very embarassing because I had to relay my orders through my broker.   What would he think of all of my silly mistakes?   So online trading has freed me up from that huge impediment to successful trading.   However, the internet and the birth of CNBC and other business shows, have created huge new barriers to trading success.   Over the years I, too, have learned that the more I insulate myself from outside influences and concentrate just on the movement of stocks, the better I trade.   One must be a loner and confident in one’s own judgments to be a successful trader.   Wyckoff’s advice remains incredibly applicable today, some 80 years later.   The market and trading are deeply intertwined with human psychology, which has changed little over time……………

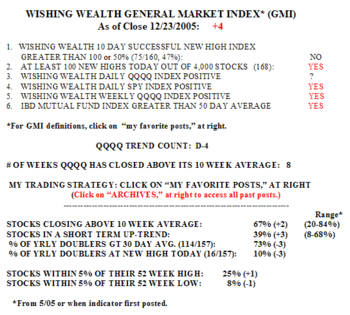
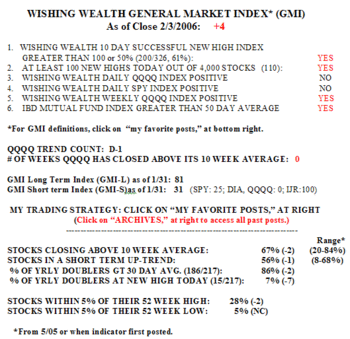
The GMI fell to +4 on Friday.   More importantly, the GMI-S, which is a measure of just the short term trend, fell to 31.   It had been 75 earlier in the week.   Gmi0203 The QQQQ and the DIA have readings of zero, and the SPY has a reading of 25.   The small cap index still reads 100.   So there is a tale of two markets, for now.   There were only 110 yearly highs in my universe of 4,000 stocks and only 7% of stocks that doubled the past year hit a new high.   20% of the Nasdaq 100 stocks rose on Friday, along with 28% of the S&P 500 stocks and 23% of the Dow 30 stocks.   The QQQQ is now below its 10 week average and Friday was day one (D-1) in the new short term decline in the QQQQ. The GMI-L is at 81 and the long term trend is still up, for now.
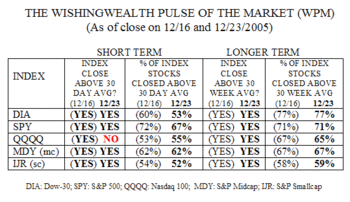
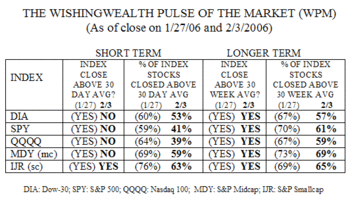
The WPM shows the considerable damage done to the large cap indexes last week.   All indexes but the IJR (small caps) closed below their 30 day averages; only 39% of the QQQQ component stocks closed above their 30 day averages, along with 41% of the SPY stocks.     Wpm0203 59% of the mid caps and 63% of the small caps closed above their 30 day averages.   All five indexes remain above their longer term 30 week averages, as do the majority of their components stocks…………….
I get out of the market in my trading account when my short term indicators point to a down trend.   I have therefore moved up all stops close to support levels and will be sold out if they weaken this week.   With the end of earnings season approaching there is little to prop stocks up.   I am also worried that the market has not been able to hold the rebound from the large decline on January 20.   And I fear that the declines in stocks like AAPL, GOOG, ISRG and AMZN are ominous signs for the future of this market.   By the way, doesn’t 4.7% unemployment mean that there are still about 15 million people looking for jobs?   That estimate also excludes the millions who have given up looking for employment.   How we play with economic statistics…………..

Please send your comments to:   silentknight@wishingwealthblog.com.
Happy New Year–What if?; GMI: +2; Trade with the trend

                                                                  What If?

What if……………

…no one can predict the stock market;

…high paid pundits only predict the past;

…Cramer is a modern day Elmer Gantry;

…the stock market is a big casino,  a la Nicolas Darvas;

…to survive, analysts and brokers promote an illusion of order and complexity;

…psychology matters more than fundamentals and facts.

Then we might isolate ourselves from outside opinions, use our charts to maximize the chances of a gain, place our bets, and quickly and ruthlessly cut our losses.  In harmony with the trend and with thoughtful trial and error, each small loss brings us closer to the next big gain………….

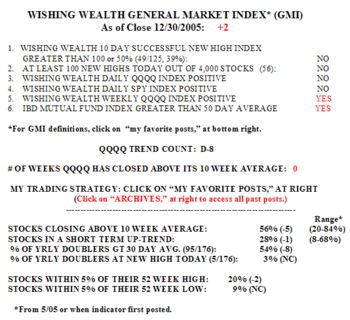
The GMI closed out the year with a +2.  A short term down trend is in effect, while the longer term up trend remains intact.  However, as we shall see below, the WPM shows some signs of weakening in the longer term trend of the component stocks of the five indexes I follow. One of the things that worries me is that the percentage of investment newsletters that are bullish is at 60.4%, with only 20.8% bearish.  This is a contrary indicator–market peaks tend to be formed when most advisers are bullish. 

There were only 56 new highs on Friday, and 45 new lows, in my universe of 4,000 stocks.  Gmi1230 Only 39% of the 125 stocks that hit a new high ten days earlier closed higher on Friday than they did ten days before.  21% of the Nasdaq 100 stocks advanced, along with only 17% of the S&P 500 stocks and 7% (2) of the Dow 30 stocks.  The QQQQ has now closed below its 10 week average for the first time in nine weeks.  Only 56% of the stocks in my universe closed above their 10 week averages and a mere 28% are in a short term up trend. Just 3% of the 176 stocks that have doubled in the past 250 days hit a new high on Friday; the leaders have stalled.  20% of stocks remain within 5% of a new high.  Friday was the eighth day (D-8) in the QQQQ down trend. Since this down trend was identified on 12/20, the QQQQ has fallen 1.3% and only 40% of its component stocks closed higher on Friday since 12/20.  With 60% of the Nasdaq 100 stocks declining during this period, why not be short or in cash, and go with the trend.  So many of us lose money by staying long when the trend is down.  The pundits scare us into believing the myth that we will miss the train when the turn suddenly comes.  However, when a meaningful turn comes, there are many weeks and sometimes months during which we can hitch a ride.

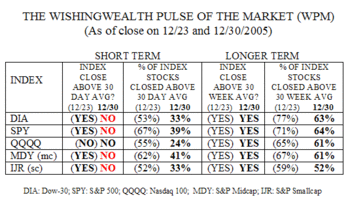
The WPM showed marked deterioration in all five indexes.  Wpm1230 All indexes closed below their 30 day averages and are in short term down trends.  Only 24% of the Nasdaq 100 stocks closed above their 30 day averages, along with 33-41% of the components of the other indexes.  While all five indexes closed above their 30 week averages, only a reduced 52-64% of their component stocks did.  Time will tell whether this longer term weakening will develop into a longer term down trend.

So we begin the new year in the midst of a confirmed short term down trend.  For me, this is a time to be short or in cash.  Can this trend reverse quickly?  Of course.    If the market turns up, I can turn on a dime, or dollar, along with the GMI.  The key to conservation of capital is not to fight the current market down trend, especially in view of the strong bullish sentiment found among advisers.  As always, the new year will bring tremendous opportunities for profiting on the bull and/or bear side, as long as I trade in harmony with the market trend and cut my losses quickly.

Please send your comments to:  silentknight@wishingwealthblog.com.
GMI: +4; Mixed signals; GMI: contrary indicator? New Year Nicolas Darvas type stocks

The GMI remains at +4, and the market should reveal its short term trend this week.   The QQQQ closed Friday just below its 30 day average, and its declining 10 day average is just above the 30 day average (41.52/41.49).   The last time the QQQQ’s 10 day average was below its 30 day was on October 31 at the beginning of the rally. Tomorrow’s close should be very important for defining the short term trend. Gmi1223Only 47% of the 160 stocks that hit a yearly high ten days ago closed higher on Friday than ten days earlier.   In addition, only 10% of stocks that have doubled in the past year hit a new high.   Thus, there is some pressure on the leaders and stocks hitting new highs.   On the other hand, there were 168 new highs in my universe of 4,000 stocks.   But only 50-53%   of the stocks in the Nasdaq 100, S&P 500 and the Dow 30 indexes advanced on Friday.   The percentage of stocks in a short term up trend has risen from 33% early last week to 39%, and 67% of stocks remain above their 10 week averages.   Three times as many stocks are within 5% of a new high than a new low (25%/8%).   This was the eighth week that the QQQQ has closed above its 10 week average, but Friday was the fourth day in this QQQQ down trend (D-4). We therefore have a weak short term trend within a stronger long term up trend.

The WPM also shows this lesser short term strength in the QQQQ (Nasdaq 100) index.   The QQQQ is the only index that closed below its 30 day Wpm1223average, and only 55% of its components stocks closed above their 30 day averages. The S&P 500 stocks show the greatest short term strength, with 67% of its stocks above their 30 day averages.   The S&P Small Cap Index components are also relatively week, with only 52% above their 30 day and 59% above their 30 week averages…..

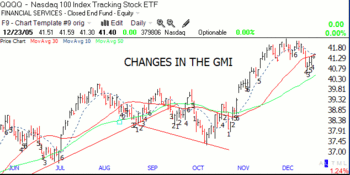
A reader wrote me that he thinks the GMI is a contrary indicator.   I don’t see it. Gmi1223changes As this chart (click on to enlarge) of the changes in the GMI shows, the GMI registered a +5 or 6 during the major rallies in July and November.   And when it was below 4, it was generally a declining market……………..

I hesitate to list any stocks that I find promising when the QQQQ is weak, but my scan did find some stocks to watch in the new year, if the market up trend resumes:

INGR,TIE,HSVLY,GOOG,LMS,CRM,GMXR,

AAPL,LDSH,AIRM,UBB, ARD, MDR, DBRN,GHL.

All of these stocks (I own a few) are near their all-time highs and have recent quarterly earnings increases of 100%+.   With the exception of CRM, their PE’s are all less than 100.   They all gained in price at least 80% in the past year.   Nicolas Darvas (see links below and to the right) used to concentrate on leading stocks at all-time highs that have already doubled.   To find a stock that will double, I find it best to find one that has already doubled.   Of course, when buying such high momentum stocks, I must immediately limit risk by placing a stop loss order……………..