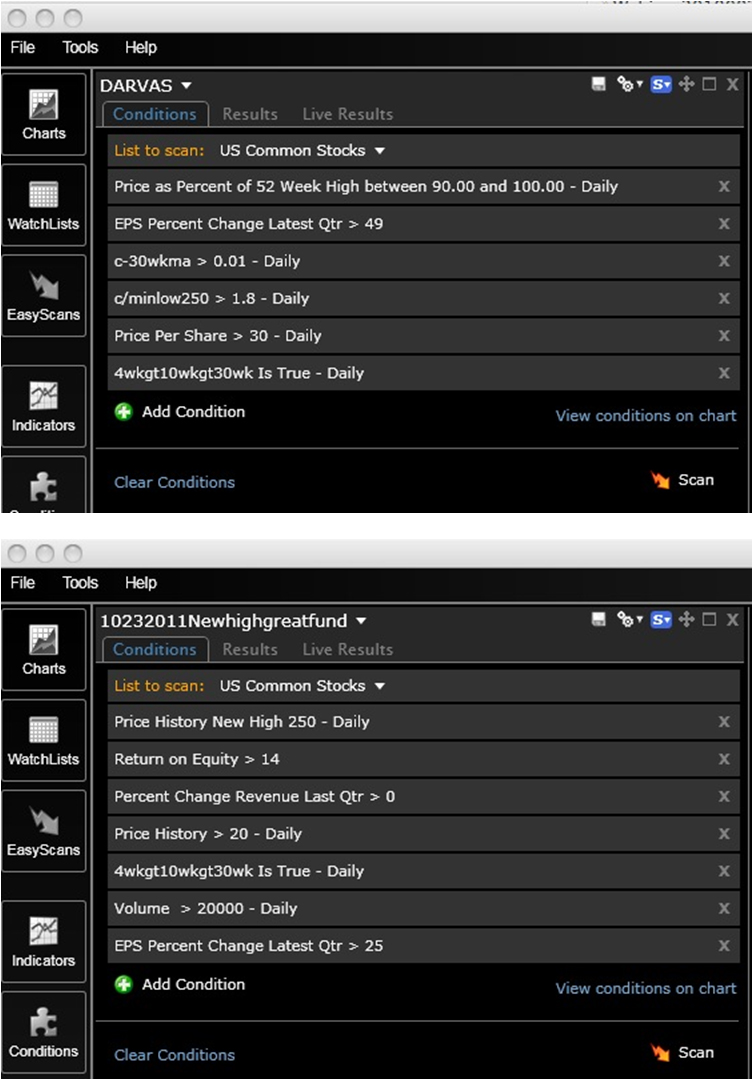
Here are the scans I presented at the seminar: (click on to enlarge)
Stock Market Technical Indicators & Analysis
Here are the scans I presented at the seminar: (click on to enlarge)
I had a wonderful time meeting many of you and sharing some of my experiences trading the markets. There are a number of loose ends from my presentation that I wanted to clear up today:
1. Worden will produce the videos of my sessions and of the entire seminar series. Call: 1-800-776-4940 or email: support@worden.com. It will take at least 30 days before they have completed editing my sessions.
2. A number of people asked me about selling covered calls. I think writing covered calls is a great strategy for us boomers, once we have a systematic way for selecting appropriate stocks. I think that the best simple sources for learning this technique are the books and videos of Allan Ellman. The books I like have been added to the books at the lower right of this page. You can check him out at his site: thebluecollarinvestor.com. He has a simple book written a few years ago, Cashing in on Covered Calls, which is a terrific primer. His latest book is much larger and comprehensive. Once you understand the strategy, look at the chapter on covered calls in Lee Lowell’s book. I am teaching myself to write the new weekly covered calls on the SPY and QQQ.
3. Some people were confused about how I use the GMI signals. The present market situation provides a good example. The QQQ weekly chart is in a Stage 2 up-trend. As long as the weekly pattern remains in a Stage 2, I keep my university pension invested in mutual funds. There are limits to how often I can trade the mutual funds. I only sell my pension funds when the 30 week average curves down. I am short or in cash with my more short term IRA and speculative money, however, because the GMI gave me a sell signal last week (2 consecutive days below 3). Other indicators I monitor to guide my short term trading are the patterns of the 30 day averages of the SPY, DIA and QQQ, their daily 10.4.4 stochastics readings, the WordenT2108 Indicator and IBD’s market pulse (currently “in a correction.”).
Remember what I said at the seminar, however, Every person must design a systematic set of entry and exit rules that fit with his/her tolerance for risk. Without such a set of rules, it is preferable to forego individual stocks and to buy some index ETF’s like SPY or QQQ and to just ride the major market trend. If you want to teach yourself some safe strategies, read my blog daily and the books to the lower right of this page. I will continue to share my experiences here, and please feel free to post a comment for everyone or to send me an email………
The GMI remains at 2 (click on table to enlarge). 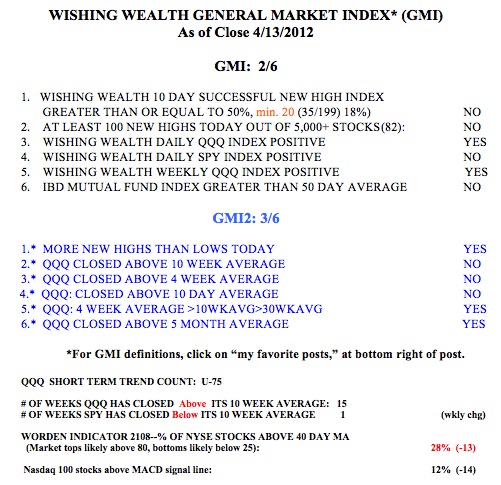 The SPY and DIA have now closed below their 10 week averages, a sign of weakness. The QQQ is showing more strength and has closed above its 10 week average for 15 weeks. However, another down day in the QQQ could send the GMI to 1 and begin a new short term down-trend in the QQQ. The QQQ short term up-trend reached 75 days on Friday. It is rare for QQQ short term up-trends to last much longer than this. Only 12% of the Nasdaq 100 stocks closed with their MACD above their signal lines, a sign of short term weakness. The Worden T2108, at 28% is still in neutral territory. The only real positive sign of technical strength is that the 10.4 daily stochastics for the QQQ is nearing oversold levels, at around 22. With a lot of key earnings to be released this week, volatility will be high. This is a good time for me to be safely on the sidelines in my trading accounts.
Please be sure to introduce yourself at the DC seminar.