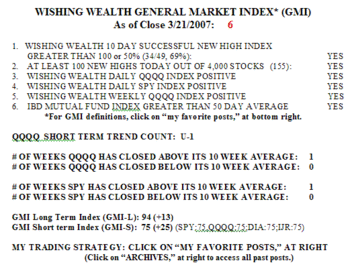
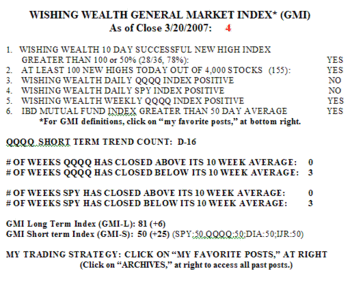
The GMI remains at 6 and the GMI-L is back to 100. Thus, most of my short and long term indicators are positive. 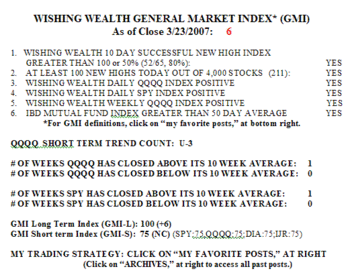 My long term trend indicator is based on Stan Weinstein’s stage analysis (see book to right). Stan used the 30 week moving average as the best indicator of a stock’s or the market’s trend. The recent steep decline in the major indexes caused my short term daily indicators to flash negative. However, Weinstein’s indicators stayed positive throughout the decline. In fact, the major indexes all found support at their rising 30 week averages. Thus, as this chart of the Nasdaq 100 index shows, the markets remain in a Weinstein Stage 2 up-trend. I never own stocks when they or the market are below their 30 week averages.
 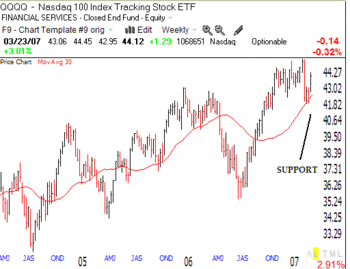 The recent support found at the 30 week average in all of the major stock indexes suggests to me that that the up-trend remains intact. In my trading account I get in or out of stocks based on my daily indicators. In my long term mutual funds, however, I only get out of the market when the 30 week averages flash trouble. This rule got me out of the market in 2000 and back in in 2003.
See my disclaimers at the bottom of my prior post.
