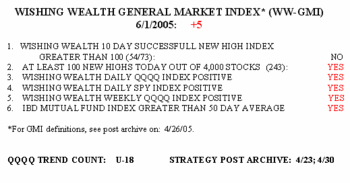
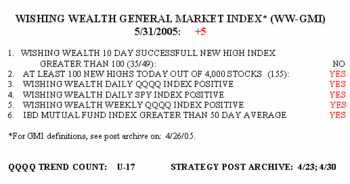
Well, it finally happened–the GMI (see archive: 4/26 post) hit +6! 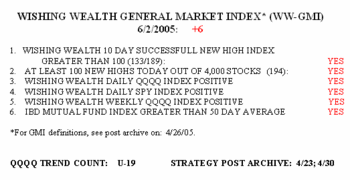 For the first time since we began to post the GMI, there were more than 100 successful 10 day new highs–stocks that hit a new 52 week high 10 days ago and closed higher today than 10 days ago when they hit their highs. This result assures us that buying stocks at new highs has become profitable and relatively common. In contrast, there were only 10 “successful” 10 day new lows. (Shorting new lows is not the way to go now.) There were almost 13x more new highs today than new lows (194/15) in my universe of almost 4,000 actively traded stocks. And 71% of the Nasdaq 100 stocks rose today, 54% of the S&P 500 stocks and 50% of the Dow 30 stocks. The Nasdaq tech stocks continue to lead this market.
The GMI indicates this market has begun a solid up trend. How long will it last? No one knows. The QQQQ index is in its 19th day of the up trend (U-19). Many of you may think that you missed this market. However, the last time the GMI indicators looked like this, the QQQQ up trend lasted about 92 trading days (August, 2004 through January, 2005.) Of course, the rise could end tomorrow–past performance does not predict future results…………………………………….
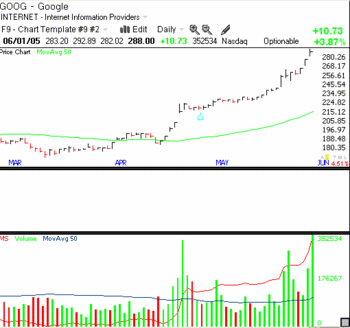
A reader alerted me this week to the growing strength in CME, one of the big winners of 2004. 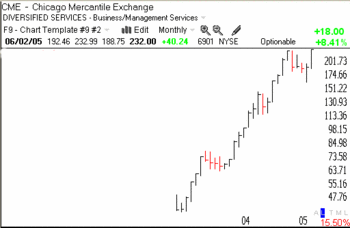 (I meant to mention CME last night–sorry.) Often times a stock doubles or triples and then when it looks like it has topped out I forget about it only to see it surge back to new peaks. CME quadrupled and then hibernated for 4 months and then started up again in the past month (see monthly chart). So I decided to make a pilot buy of a very small number (30) of shares on Tuesday morning at the open at 212.20. I then placed a sell stop in below the prior day’s low at 209 and a buy stop in above the day’s high around 218, thinking it might rise to that in a few days. If it fell, I was only risking 3 points. Well, CME broke through today and I automatically bought more around 219 and the stock closed at a new all time high of 232 today on very high volume. This is the type of action one gets in rockets in a strong market. Note that this trade all began with a modest 30 share pilot buy, so that I had minimal risk and only added more when the stock moved up nicely…
Now for the ugly dogs of the day. In spite of a powerful market, sudden declines happen. We must protect ourselves from these situations by using stops, by making pilot buys and gradually accumulating shares, and by not concentrating more than 20% of our funds in one position.
One Foolish writer said that people were offered QSII today at a discount. I say that owners of the stock were decimated by the stock’s sudden 15%+ drop today–no welcome bargain to them.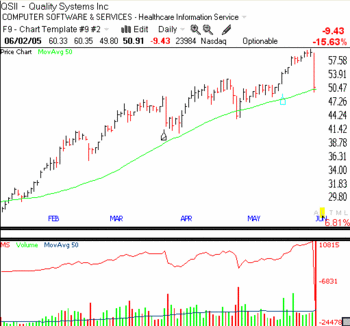 Here is a stock that was rated #1 in the IBD 100 list 2 weeks ago and rated #2 last week with an A+ composite rating, and EPS rating of 99 and an RS of 98, that just fell apart on huge daily volume without any news. I was stopped out of this stock today at about 55.95. I had placed my stop below the low of the day on May 18 when the stock went to a new high on considerable volume. I figured if the stock fell below that day’s low it was a bad sign. So, I was automatically sold out at 55.95 and the stock closed at 50.91 today after hitting a low of 49.80. I could find no advance technical warning of this decline. So, even stocks with great IBD ratings can suddenly drop–a perfect reason why one must slowly accumulate a position and not concentrate most of one’s funds in one stock.
A die hard O’Neil follower would say that if the stock had been bought at the proper pivot point, around 52, a trader would have had a minimal loss today. Note that the stock did stop at its 50 day average today. One way to play this stock, if I still held it, would be to place a sell stop below today’s low, around 49.70. At the end of April, QSII had a similar large decline but bounced back the next day. After a sudden one day decline, it often works to place the sell stop right below that day’s low. We’ll see if it works for QSII tomorrow…
Another train wreck today that was brought to my attention by a reader, was CMN. (Click on chart to enlarge.)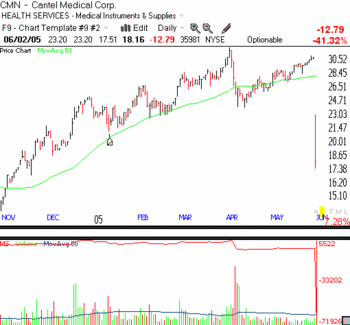 Here was another stock with high IBD ratings (Composite of 98, EPS-97, RS-96), that fell 41% today. I did not own it, but I like to think I might have seen the technical warning signs. First, there was that big decline on huge volume in early April. Second, notice the low volume, consistently below the 50 day average (blue horizontal line) during the subsequent rebound, until today. Finally, note that the Money Stream value (red horizontal line) never regained the level it reached prior to the April decline. MoneyStream is a proprietary indicator in the TC2005 software that is a modified on balance volume indicator. It basically is a cumulative total of the volume on up days minus the volume on down days. There is no way a stop loss order would have prevented a huge loss today, given that the stock opened far below yesterday’s close. The only people who got out with less of a loss are those who sold the stock in extended hours trading, Wednesday night. On Thursday, after it was too late, the reason for Cantel’s decline was announced. Looks like someone may have known something about this contract termination in early April. (Don’t you wish you could track down those sellers and question them, under oath, about their fortuitous early sales.)
