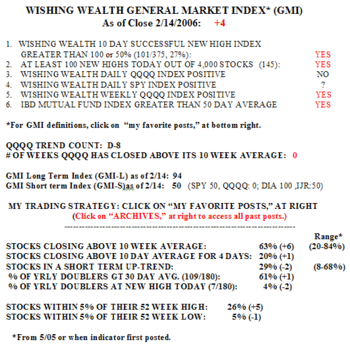
Tuesday’s rally took the GMI up two to +4. The GMI-S rose to 50, with the Dow being the strongest indicator. The GMI-L is at 94 reflecting the continuing strength in the longer term indicators.  There were 145 new highs in my universe of 4,000 stocks and 101 successful 10 day new highs. The Daily SPY Index was too close to call. Tuesday was the eighth day in the QQQQ short term decline (D-8). 90% of the Dow 30 stocks advanced on Tuesday, compared with 80% of the S&P 500 stocks and 65% of the Nasdaq 100 stocks. In spite of the strength in the Dow 30 and S&P 500 stocks, the percentage of stocks in a short term up trend declined to 29%. 26% of stocks are now within 5% of their 52 week highs. Only 4% of the stocks that have doubled the past year hit a new high on Tuesday. It appears that the strength is coming in a different set of stocks than the recent leaders.
GMI: +2; GMI-S: 19; Leaders crushed
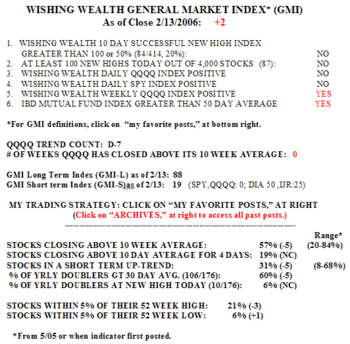
The market weakened again with the GMI now falling to +2. I do not have tomorrow’s IBD yet. If the IBD Mutual Fund Index is below its 50 day average, then we are really at +1. The GMI-S fell to 19, with the DIA being the strongest of the indexes.  Only 29% of the Nasdaq 100 stocks rose on Monday, along with 34% of the S&P 500 stocks and 40% of the Dow 30 stocks. HON, HPQ and T are among the strongest Dow stocks. There were only 87 new highs in my universe of 4,000 stocks and 84 successful 10 day new highs. Only 31% of stocks are in a short term up trend. Monday was the seventh day in the QQQQ short term down trend……….
Since its peak on January 10, the QQQQ has declined 5.6% and 60% of the Nasdaq 100 stocks have declined. During this period the leaders have been crushed. The biggest declines, in order were: GOOG (-26%), YHOO (-25%), SNDK (-23%), ISRG (-21%), AAPL (-20%), INTC (-19%), WFMI (-18%), AMZN (-17%). Most of these stocks are the IBD type of growth stocks that rocketed in a strong market. The carnage sustained by these stocks does not bode well for the market. The leaders tend to be slaughtered first in a general market decline.
Please send your comments to: silentknight@wishingwealthblog.com.
GMI: +4, GMI-S: 25; Small caps weaken; on side lines
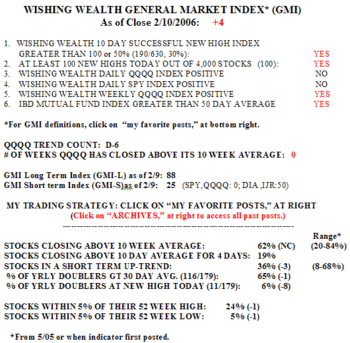
The GMI barely held +4 on Friday. A weak day on Monday could reduce it to 2. The IBD Mutual Fund Index is declining and approaching its 50 day average, suggesting that growth fund managers are having trouble making money in this market environment. The GMI-S is at 25, indicating that only 4 of 16 short term indicators for the DIA, QQQQ, SPY and IJR are positive. Even the small cap stocks are weakening (see WPM below).  Only 30% of the 630 stocks that hit a new high ten days ago closed higher Friday than they closed ten days before. Buying new highs has not been profitable. There were only 100 new highs in my universe of 4,000 stocks. Only 36% of stocks are in a short term up trend and only 6% of stocks that doubled in the past year hit a new high on Friday. 64% of the Nasdaq 100 stocks advanced on Friday, along with 59% of the S&P 500 stocks and 70% of the Dow 30 stocks. Friday was the sixth day (D-6) in the current short term down trend on the QQQQ…….
I added a new indicator to the table tonight. Stocks that are in a strong advance tend to close above their 10 day moving average for some time. This new indicator shows the percentage of stocks that have closed above their 10 day average for the past four days. 19% of the stocks in my universe did so on Friday. We will watch to see whether this turns out to be a sensitive indicator of the strength of the market….
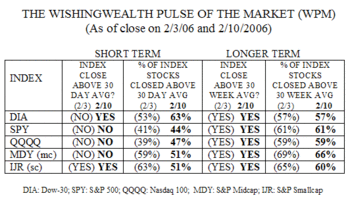
The WPM showed interesting divergences in the five market indexes last week. The small and mid cap stocks weakened, even as the DIA, QQQQ and SPY remained stable or strengthened.  The DIA is now above its 30 day average. But there were declines in the percentage of the MDY and IJR component stocks that closed above their 30 day averages. And while all five indexes closed above their 30 week averages, there were declines in the percentage of the components of the MDY and IJR that closed above their 30 week averages. This weakening in the strength of the mid and small cap stocks is a startling departure from the recent past and warrants further attention…
The markets remain in a short term down trend. It makes no sense to fight the market’s trend. Continued weakness this week will bring about a significant decline in the GMI, and may be the beginning of a serious longer term decline. This remains a good time to be on the side lines, in cash, in my trading account……
Please send your comments to: silentknight@wishingwealthblog.com.