Cramer and limit orders; ORCT and PNRA; GMI back to +5

Tonight, Cramer was upset that some of his listeners rushed out to buy Costco at the open this morning, based on his recommendation the night before,  and then got burned by buying at the high of the day (COST opened at 46.32 and closed at 45.49).  He screamed tonight that no one should use market orders–that brokers use market orders as a way of ripping off customers and selling to them stock  at an overly high price.  (A market order tells the broker to buy the stock at the next best price offered, whatever it is, without any limit.  In a limit order customers specify the maximum price they will pay to buy the stock.  If the stock opens higher than the limit price the broker can only buy the shares  if the stock comes back down to the limit price.)

One of the gurus I admire, I do not remember which, once said that fortunes have been lost by persons trying to hold out for the last 1/8th of a point on a buy or sell order.  If COST had opened at 46.32 and never traded lower today, a limit order below that price would never have been executed and the customer would have lost out on an explosive rise.  I therefore almost always trade using market orders. If I want to buy a stock I want to buy at the next best price.  I do not want to miss out on a move.  Similarly, if I want to sell because I think a stock might decline, I want to get out immediately.  I don’t worry about a few cents either way.  It could be suicide to put a limit order in on a sell and not be able to sell because the stock never traded at my limit price.  BUY AND SELL AT THE MARKET!  When I place a stop loss order at a price below which the stock is trading, it means that if the stock falls to that price,  get me out!

I am going to give you an example of a trade I made today that should illustrate these principles.Orct   One of my market scans alerted me to ORCT–a potential rocket.  Note the huge volume and rises in late January and early April.  On May 16, I purchased some of the stock (see "Buy" on chart) when I saw the stock bouncing from its moving average.  I immediately placed a sell stop (stop loss order) in to sell the stock if it fell below its moving average.  The  stock peaked on the day after I bought it and slowly returned to its average.  After this peak, I placed a stop order to buy more shares if the stock should reverse and trade above the peak of  22.90. Thus, I placed a buy stop order at 22.95 which meant that if the stock traded at 22.95 or higher, the order would become a market order to buy ORCT at the next best price.  However, before that second buy order was triggered,  my stop loss order automatically sold my ORCT shares on 5/23 when it broke below its moving average.  I was also tired of seeing the stock go nowhere in a strong market.

Now here is my point.  I did not get angry or discouraged at the way the stock had acted.  I simply automatically took my small loss.  But, just in case the stock should again reverse and break through the peak at 22.90, I left my buy stop order in place at 22.95.  How many times have I been shaken out of a stock only to have it immediately turn around and go up.  And wouldn’t you know, today, without my having to pay any attention to it, my order to buy ORCT was triggered and I bought some at 22.98.  The stock then rocketed to a new high on huge volume and closed at 24.45 today.  My stop order to buy automatically got me into the stock at the breakout point and had I used a stop limit order to buy ORCT (an order that becomes a limit order to buy at or below the limit price once the stock trades at the stop price) I might have missed climbing aboard. Some of my best trades have come from buying back shares that I had recently been scared out of by a sudden decline, when they bounced back……………………………………………

It is the greatest irony that my IBD Meetup group meets each month at the local Panera Bread shop and exchanges ideas on the next great stock.  Last night our surviving triumvirate (see yesterday’s post) was sitting at a table watching the long line of patrons.Pnra   Do you know the Peter Lynch (the successful manager of Fidelity’s Magellan fund in the 80’s)method of picking stocks?  He talks about visiting malls and observing checkout lines to see which companies are thriving, as a way of finding promising businesses.  Well, it turns out that while we were looking for winners in our chart books, a major winner was right under our noses!   PNRA (click on monthly chart to enlarge) rose about 14 fold between 2000-03 (yes, during the collapse of the Nasdaq), and then plateaued for 15 months.  In January, 2005, it burst out to a new high and is now in an uptrend, hitting a new high of 63.86 today.  Panera Bread may be a great place to make some dough in the months to come. (I couldn’t resist the pun.)

  Over the years I have noticed the wisdom of Lynch’s method.  As an avid Mac user in the early 80’s I noticed that all of the software came from the same company–something called Microsoft.  I called my broker when it went public and asked to buy some shares at the offering price of $26.  He laughed, and said I would have to buy it when it began trading.  When it opened around $40 I figured I had missed the boat.  How little I knew back then.  I didn’t make the same mistake with GOOG.  And I bought XMSR at around $2 because my son told me how great satellite radio was.  My point is to look around at the products that people in your life are enthusiastically embracing (ever hear of IPOD–too late now) and research the company immediately.  All of us have special interests and domains that we know well and which can alert us to the next winner…………………….

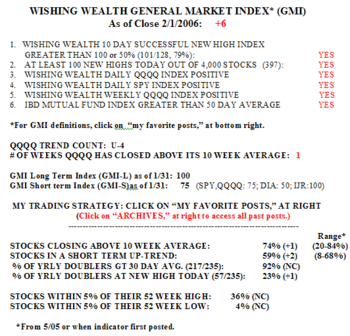
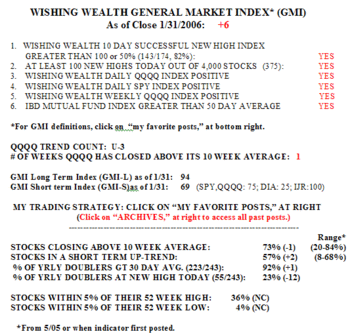
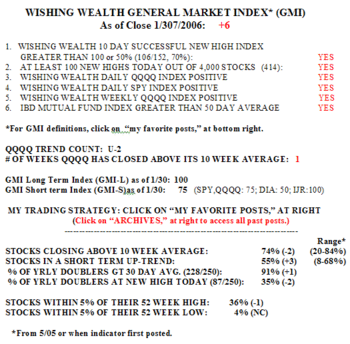
Do you wonder why I show you the GMI every day?  The reason is to remind you that a crucial key to successful trading is to be in harmony with the general market trend.Gmi526    This is the "M" in the CANSLIM approach and it is a critical element in the strategies of all of the gurus I have studied. The GMI regained +5 today because there were more than 100 stocks that reached new highs out of my universe of 4,000 stocks.  The important thing to note is that 85% of the stocks in the Nasdaq 100 rose today along with 79% of the stocks in the S&P 500 and 77% of the Dow 30.  Aren’t our chances of making successful purchases greatly increased when we have such company?  If you bought a Nasdaq 100 stock on Wednesday, you had an 85% chance of having a profit by today.  Since May 5, the QQQQ (an ETF that tracks the Nasdaq 100 stocks) has climbed 6.8% and 88 of the Nasdaq 100 stocks have increased and 28 of the 100 have increased 10% or more.  If you are still shorting or are short tech stocks, these are the steep odds you are fighting.  I am making $$$ in this market, and it is all because I am in synch with the trend. 

Send me your feedback at silentknight@wishingwealthblog.com

Please remember that the stock market is a risky place, especially now.  I am not providing recommendations for you to follow.  My goal is to share tools and methods that I have used over the past 40 years of trading, so that you may learn from them and adapt them to your trading style and needs.  While I do my best, I do not guarantee the accuracy of any statistics computed or any resources linked to my blog.  Please consult with your financial adviser and a mental health practitioner before you enter the stock market,  and please do not take unaffordable risks in the current market environment.  See the About section for more statements designed to protect you (and me) as you navigate this market. Past performance does not guarantee future results, but I would rather learn from a former winner than a loser.

Lonely IBD Meetup, GMI declines to +4

Tonight was the monthly local IBD meetup.  Normally about 8-10 persons get together to share ideas about stock trading. Tonight, just 3 persons showed up, including me.  I wrote after last month’s meeting that people were depressed, bearish and mostly in cash.  Still, I was not prepared for such a low turnout tonight.  The group leader who has lived through several market cycles was not surprised, and noted that it would take a few months of an up market with people making money, for attendance to pick up again.

I was  somewhat shocked to hear that the leader was skeptical about the longevity of the current market rise and was not interested in pursuing volatile growth stocks.  His opinion contrasted greatly with mine.  By following my market indicators, I was completely comfortable with buying and holding growth stocks and assumed that the other traders in the group would agree. The third attendee had made some profits in stocks, especially GOOG, but was relatively new to trading and had no firm take on the market.  I have to conclude that the low attendance and caution about the market constitute contrarian indicators, suggesting that this rally has more to go. I wonder if a lot of other people are turned off to the market right now.

The GMI dropped one point to +4, today.Gmi525 This is because there were only 70 new highs in my universe of 4,000 stocks. There were also only 33 successful 10 day highs.  Only 21% of the Nasdaq 100 stocks rose today, 25% of the S&P 500 stocks and 27% of the 30 Dow stocks. Clearly this was a weak day.  Today was U14, the 14th day of this uptrend.

In spite of the general market weakness, a number of the stocks I follow and/or own, rose, including: GOOG, BOOM, PRGS, NDAQ, NSI. As far as I am concerned, the market remains in an up trend and I plan to increase my positions as my stocks break to new highs or bounce off of their support levels.  Of course, I also have my sell stops in place in case things suddenly turn ugly.

Send me your feedback at silentknight@wishingwealthblog.com

Please remember that the stock market is a risky place, especially now.  I am not providing recommendations for you to follow.  My goal is to share tools and methods that I have used over the past 40 years of trading, so that you may learn from them and adapt them to your trading style and needs.  While I do my best, I do not guarantee the accuracy of any statistics computed or any resources linked to my blog.  Please consult with your financial adviser and a mental health practitioner before you enter the stock market,  and please do not take unaffordable risks in the current market environment.  See the About section for more statements designed to protect you (and me) as you navigate this market. Past performance does not guarantee future results, but I would rather learn from a former winner than a loser.

Darvas’ stock market casino, fabricated fantasy, interest rates resume rise, a new trend count; GMI: +5

"It means, as I see it, that the corporation gets the money it needs, absolutely free and clear of any obligation to repay it–ever.  The underwriters get their cut or commission (or both) for placing the stock issue.  The stockbrokers who handle all subsequent transactions in the stock get their commission.  And the public will get "shares" (i.e., chips) with which to gamble–the gamble being, of course, that someone else will pay you a profit on them in the hope of selling them to a third person for a little bit more , and so on in an endless cycle of speculation.  This is, in essence, the entire story of the stock market, as I have found it."

Nicolas Darvas, Wall Street: The Other Las Vegas, Kensington Publishing, 1964, p. 54-55.

I read Darvas’ books in the 1960’s and they had and continue to have a profound impact on my approach to the market.  I know that William O’Neil and some of his colleagues have also referred to Darvas’ influence on their trading strategies.  Here is a man, Darvas, who made almost 2 million dollars in the stock market in 18 months while he danced around the world, subsequently saying that the stock market was just a venue for gambling.

After the internet bubble and the tech stocks collapsed so badly in 2000-02, I think many of the people who were so badly burned, would agree with Darvas.  Nevertheless, there persists an entire industry of people who attempt to make the market seem rational and spend lots of time analyzing the "true value" of stocks.  What if Darvas is right?  All of these people and institutions who are paid millions of dollars for their financial advice are simply involved in a world of fabricated fantasy.  If Darvas is right, the idea of having people trusting their economic futures (and social security) to the whims of the great stock market casino terrifies me. As Darvas says at the end his book, "I walk into the Casino with my eyes open as I would if I were walking into a Casino in Las Vegas.  I ignore the chatter, I watch the action; and, I try my luck."  I believe that this is our mission as market technicians. ……………………………………….

The GMI held at +5 today.  The market has weakened some, Gmi524 however, with only 132 new 52 week highs, down from 197 new highs on 5/18.  There were 28 new lows in my universe of almost 4,000 stocks.  Successful 10 day new highs were 50 today, down from 84 on 5/19.  Only 46% of the Nasdaq 100 stocks rose today, 41% of the S&P 500 stocks and 43% of the Dow 30.  Put another way, the majority of the stocks in these indexes declined or were unchanged today.  This rally may be taking a breather.  Note that the GMI is explained in my post on 4/26.

As long as the GMI stays at +5, I feel comfortable holding stocks and buying stocks that bounce off of support levels.  I am not as confident of buying new highs right now, however. Some of my stocks hit new highs today but closed near their lows of the day (GOOG, BOOM).

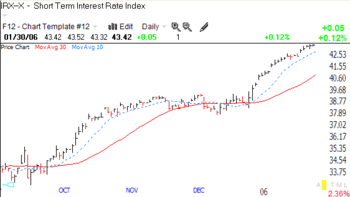
There is one big negative that I see.  The short term interestIrx524_1 rate index went to a new high today (click on figure to enlarge). Speculators are again betting on more Fed rate hikes and this could eventually torpedo the market.  If it does, the weakness will show up in the GMI.  Nevertheless, the resumption of the rise in this index just makes me a little more cautious about the possible longevity of this bull move…………………………………………….

I am introducing today another indicator I find useful.  I simply count the days since the current trend began.  Today is day 13 of the rally, as I define its inception.   I will use the term U-13 (for today’s count) to designate the duration of an uptrend. A downtrend will be indicated by D-xxx.  This indicator will help us to monitor the maturity of a trend.  At some point I will show you an analysis I did of the duration of up and down trends over the past few years.  It helps me to determine how likely it is that a trend will continue. In future posts I will include this trend count in the GMI indicator box.

Send me your feedback at silentknight@wishingwealthblog.com

Please remember that the stock market is a risky place, especially now.  I am not providing recommendations for you to follow.  My goal is to share tools and methods that I have used over the past 40 years of trading, so that you may learn from them and adapt them to your trading style and needs.  While I do my best, I do not guarantee the accuracy of any statistics computed or any resources linked to my blog.  Please consult with your financial adviser and a mental health practitioner before you enter the stock market,  and please do not take unaffordable risks in the current market environment.  See the About section for more statements designed to protect you (and me) as you navigate this market. Past performance does not guarantee future results, but I would rather learn from a former winner than a loser.