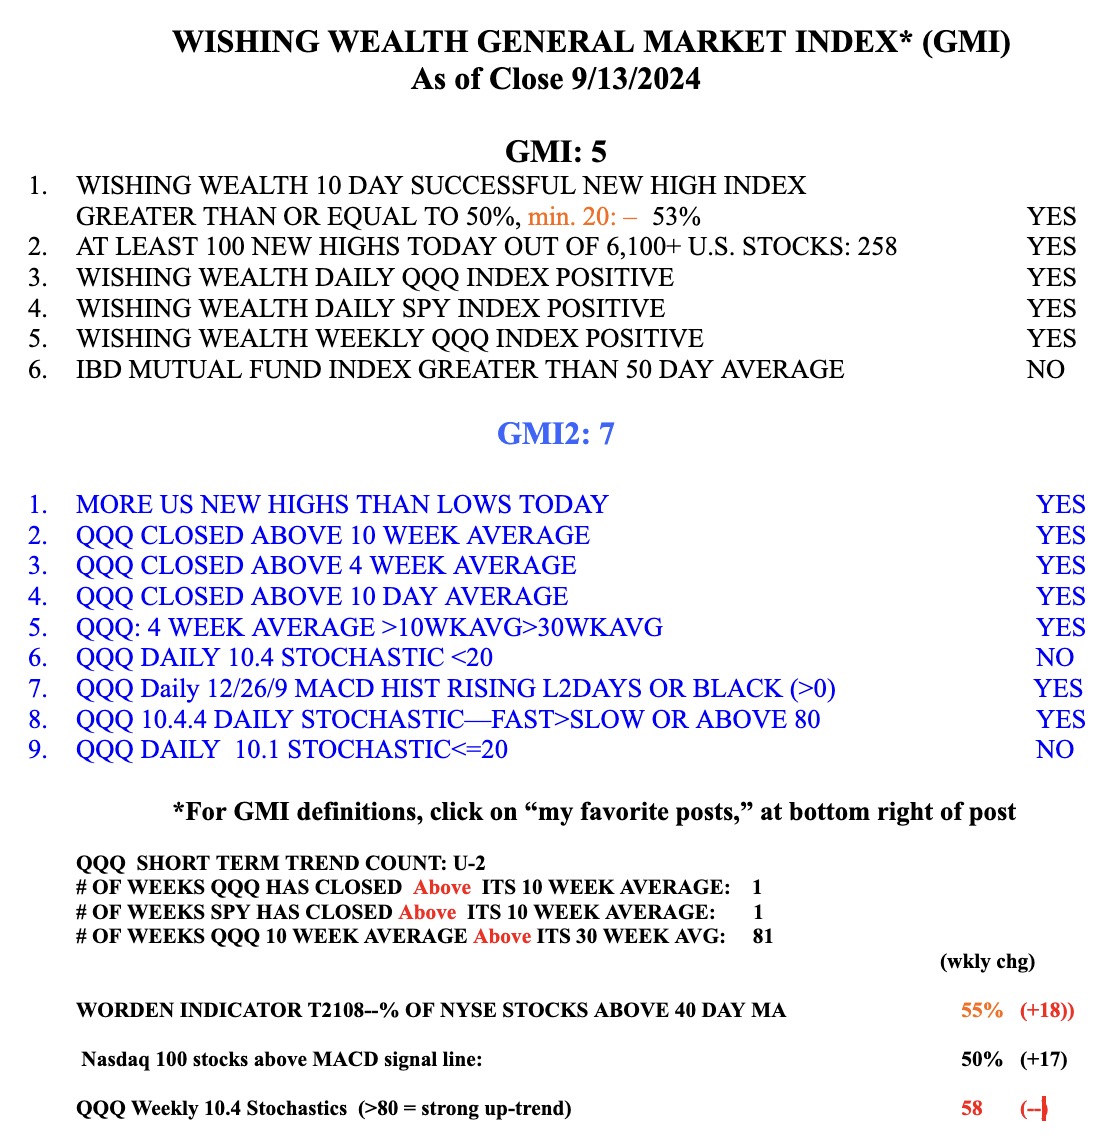
My 10:30 weekly chart shows that QQQ has regained strength and is riding above its 10 and 30 week averages.


Stock Market Technical Indicators & Analysis
My 10:30 weekly chart shows that QQQ has regained strength and is riding above its 10 and 30 week averages.
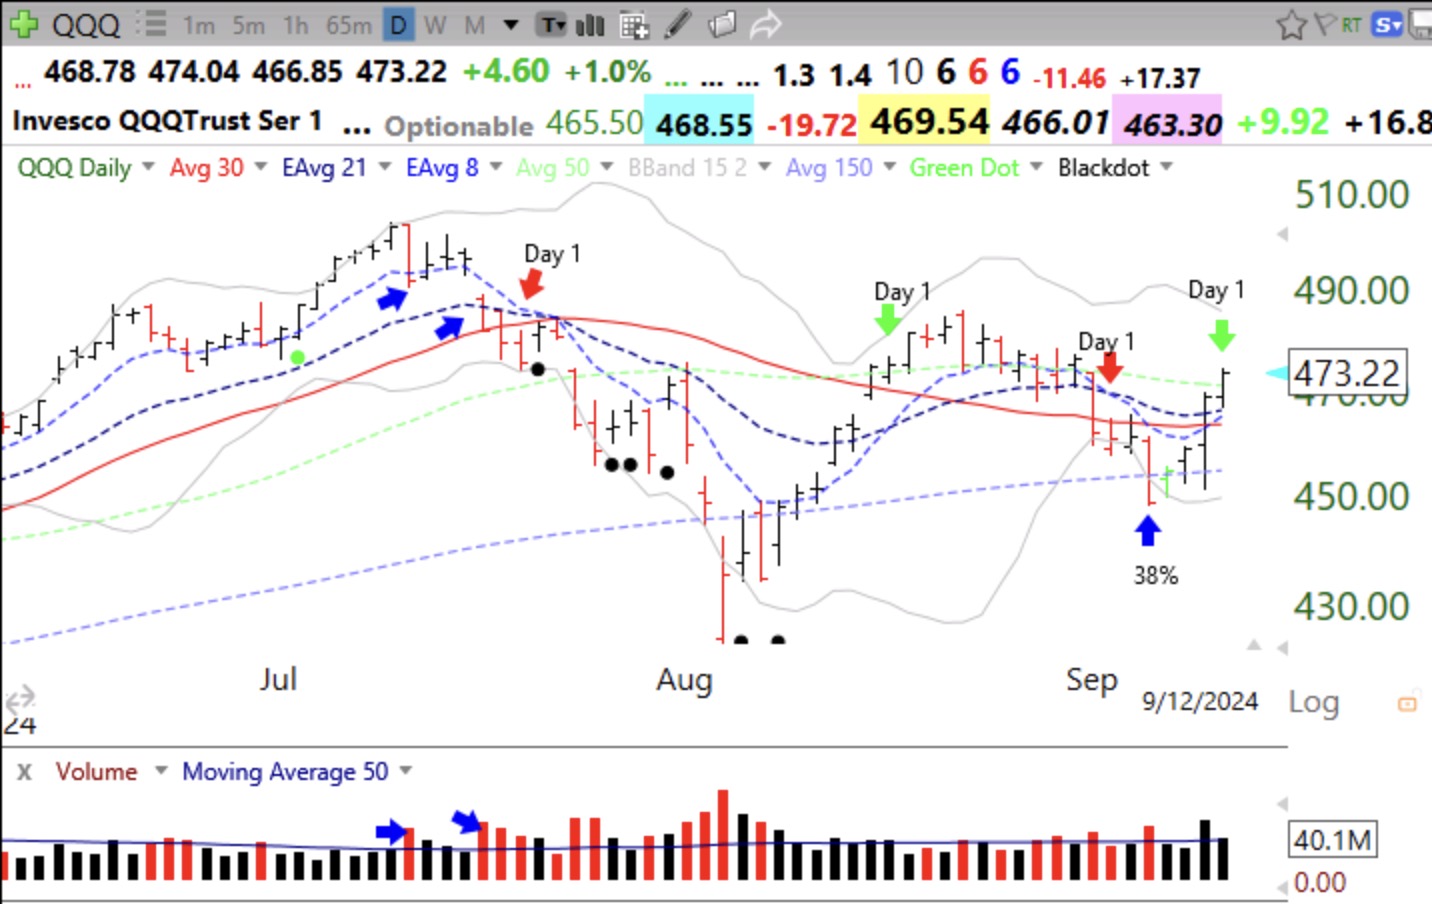
Time to be out of SQQQ and to nibble at TQQQ. QQQ short term trend could turn up by Thursday’s close. I have to be nimble to catch the changing trend. Note the accumulation day on Wednesday. Only 38% of my new class of 130 students thought QQQ would rise this week. Learning what a contrarian indicator is.