Stock Market Technical Indicators & Analysis
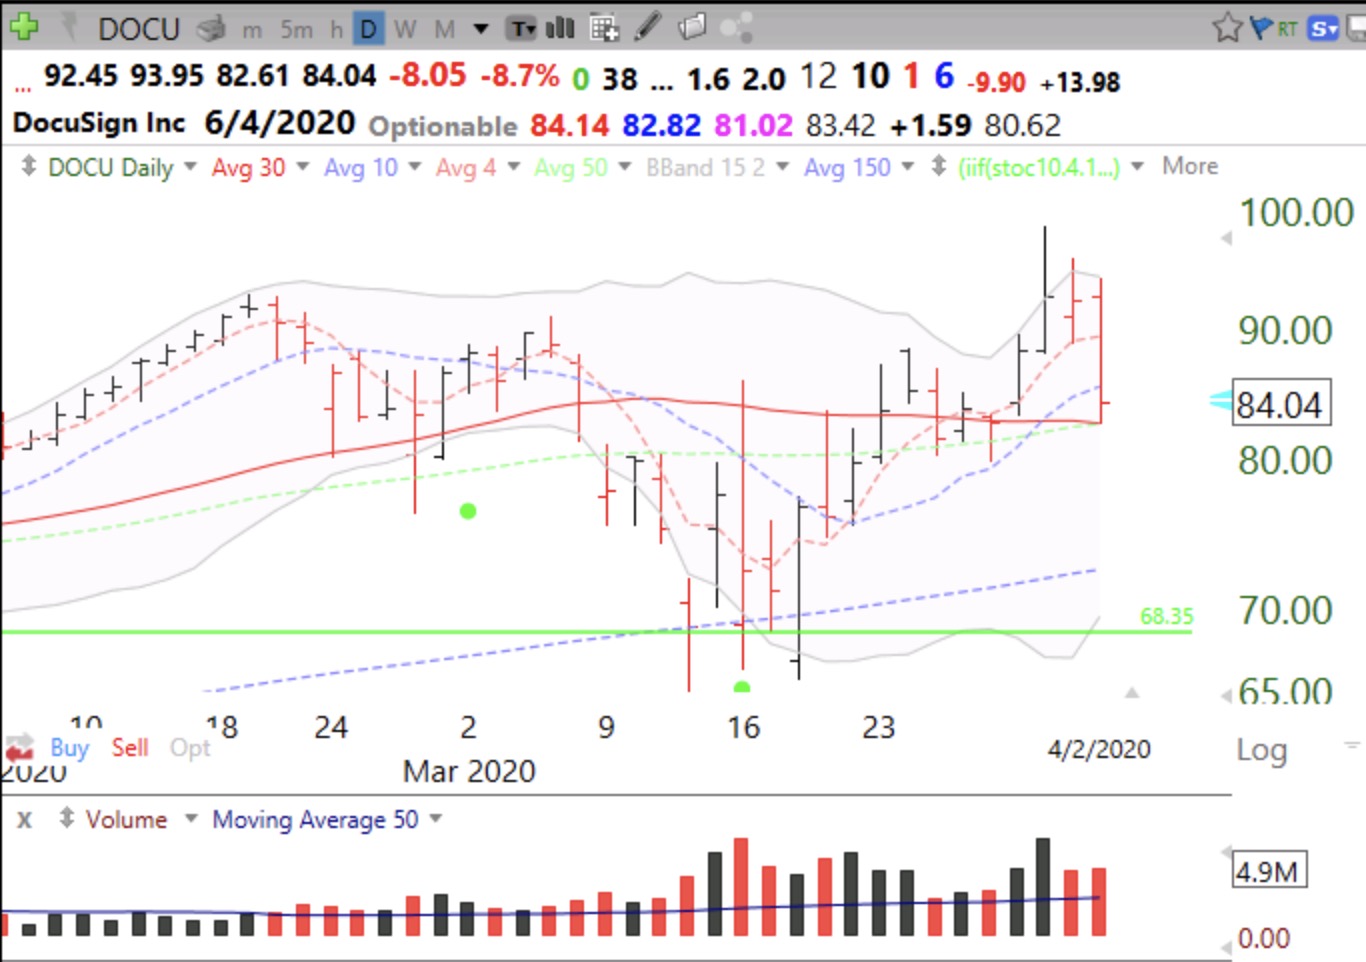
People need a way to sign papers from a distance digitally. Note the recent retest of its GLB.
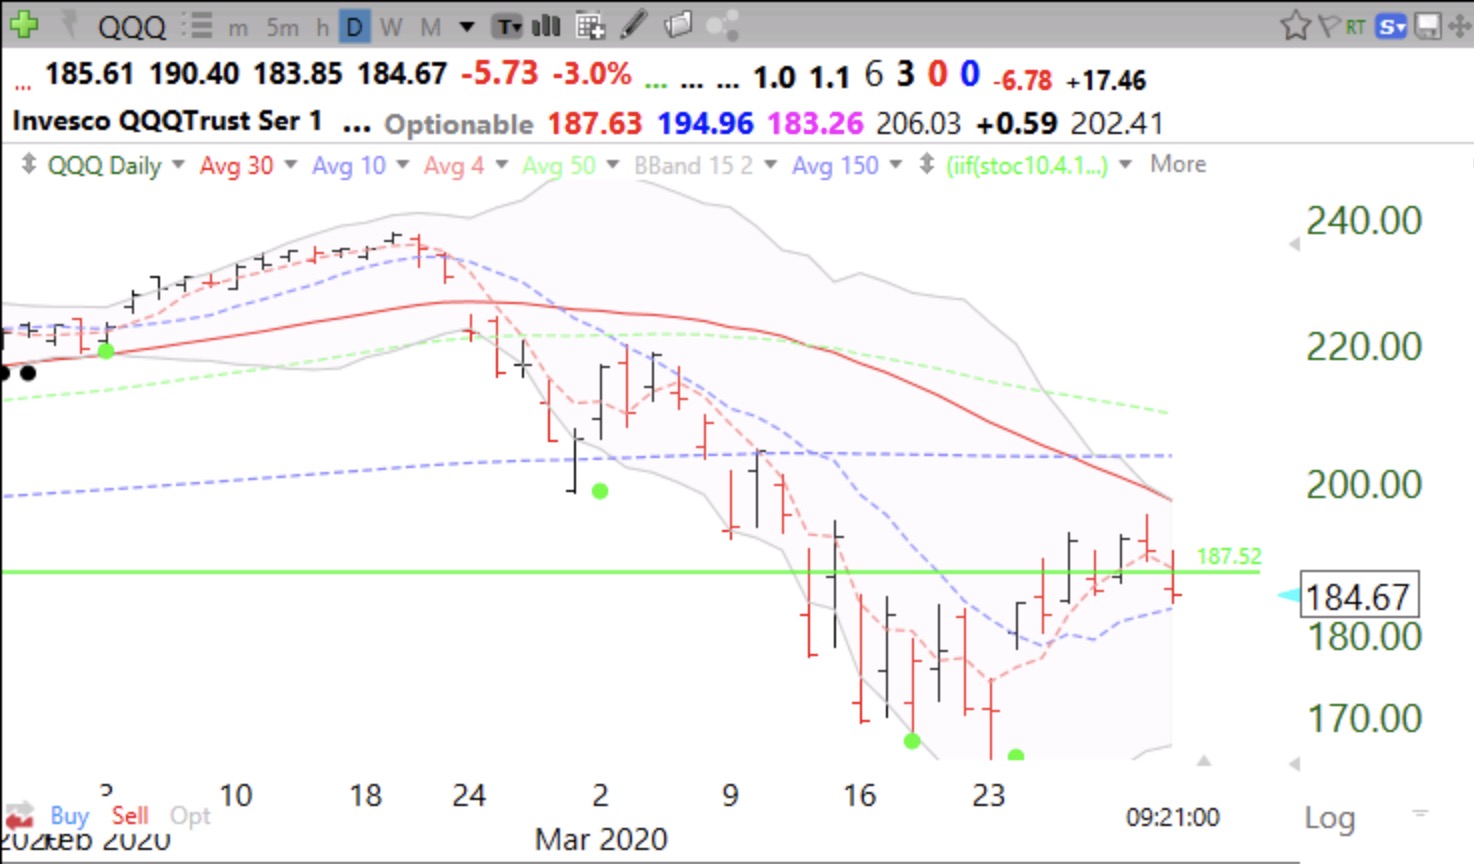
Will low of 3/23 hold or was the first decline just a prelude? Note that the QQQ was approaching resistance at the 30 day average (red line) and the upper daily 15.2 Bollinger band.