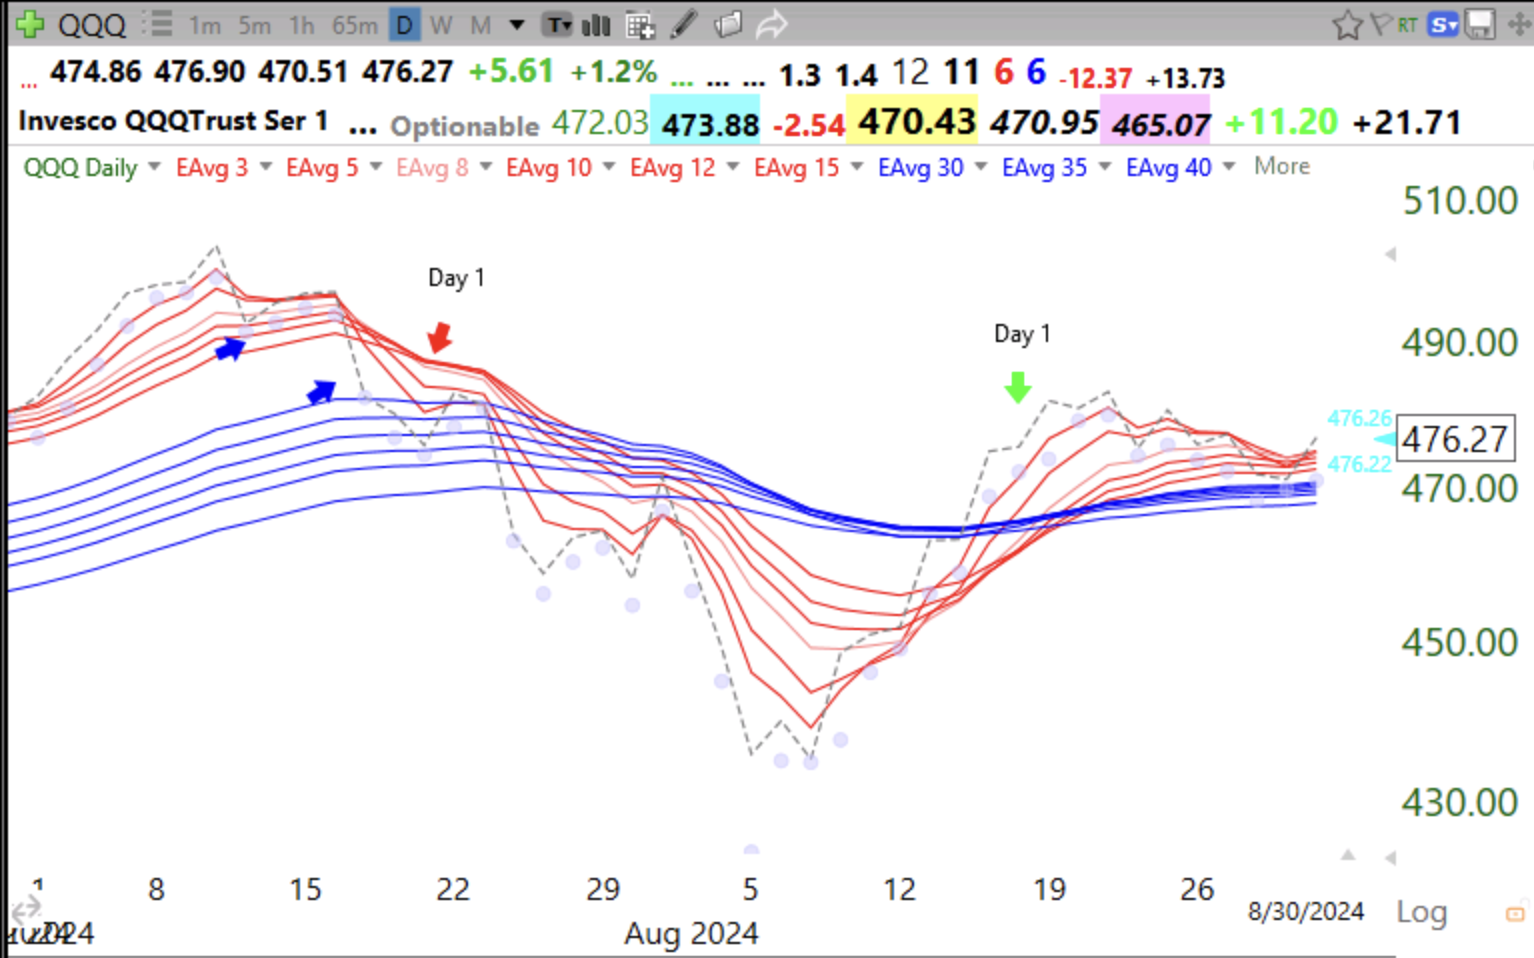
QQQ closed back below all 12 averages. RWB up-trend over. Time to be very defensive.

Stock Market Technical Indicators & Analysis
QQQ closed back below all 12 averages. RWB up-trend over. Time to be very defensive.
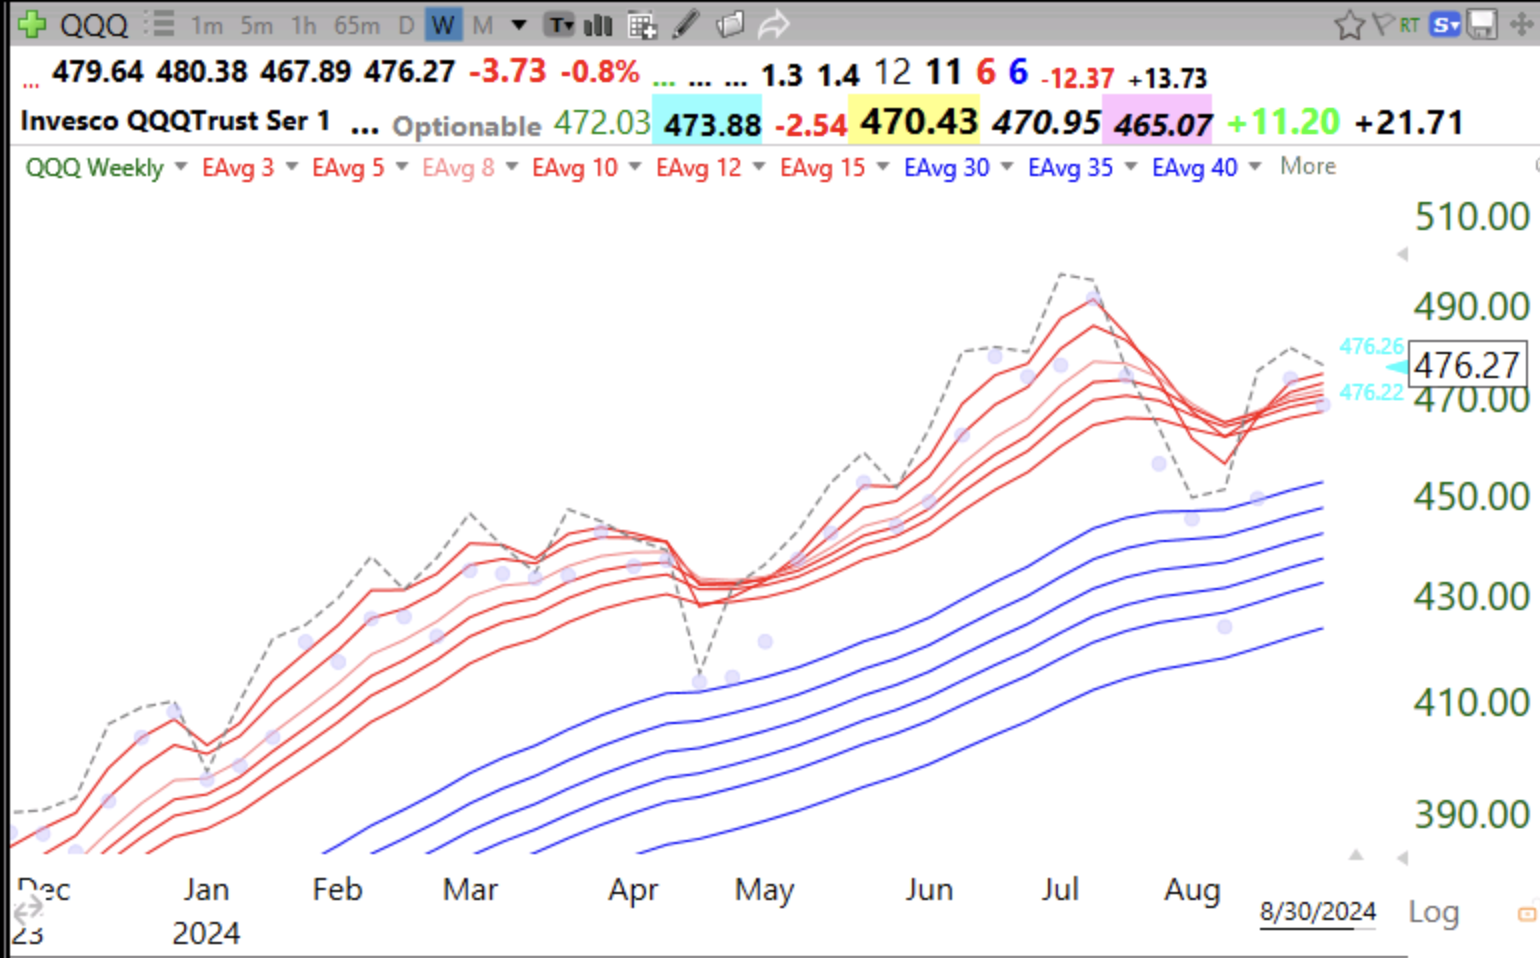
The daily modified Guppy chart shows that the QQQ RWB up-trend remains intact. QQQ is also in a longer term weekly RWB up-trend. RWB means that the shorter term averages (red) are all rising above the longer term averages (blue) with a white space between them. The dotted line is the closing price for the selected period. ATH=all-time high. I am still holding some TQQQ.