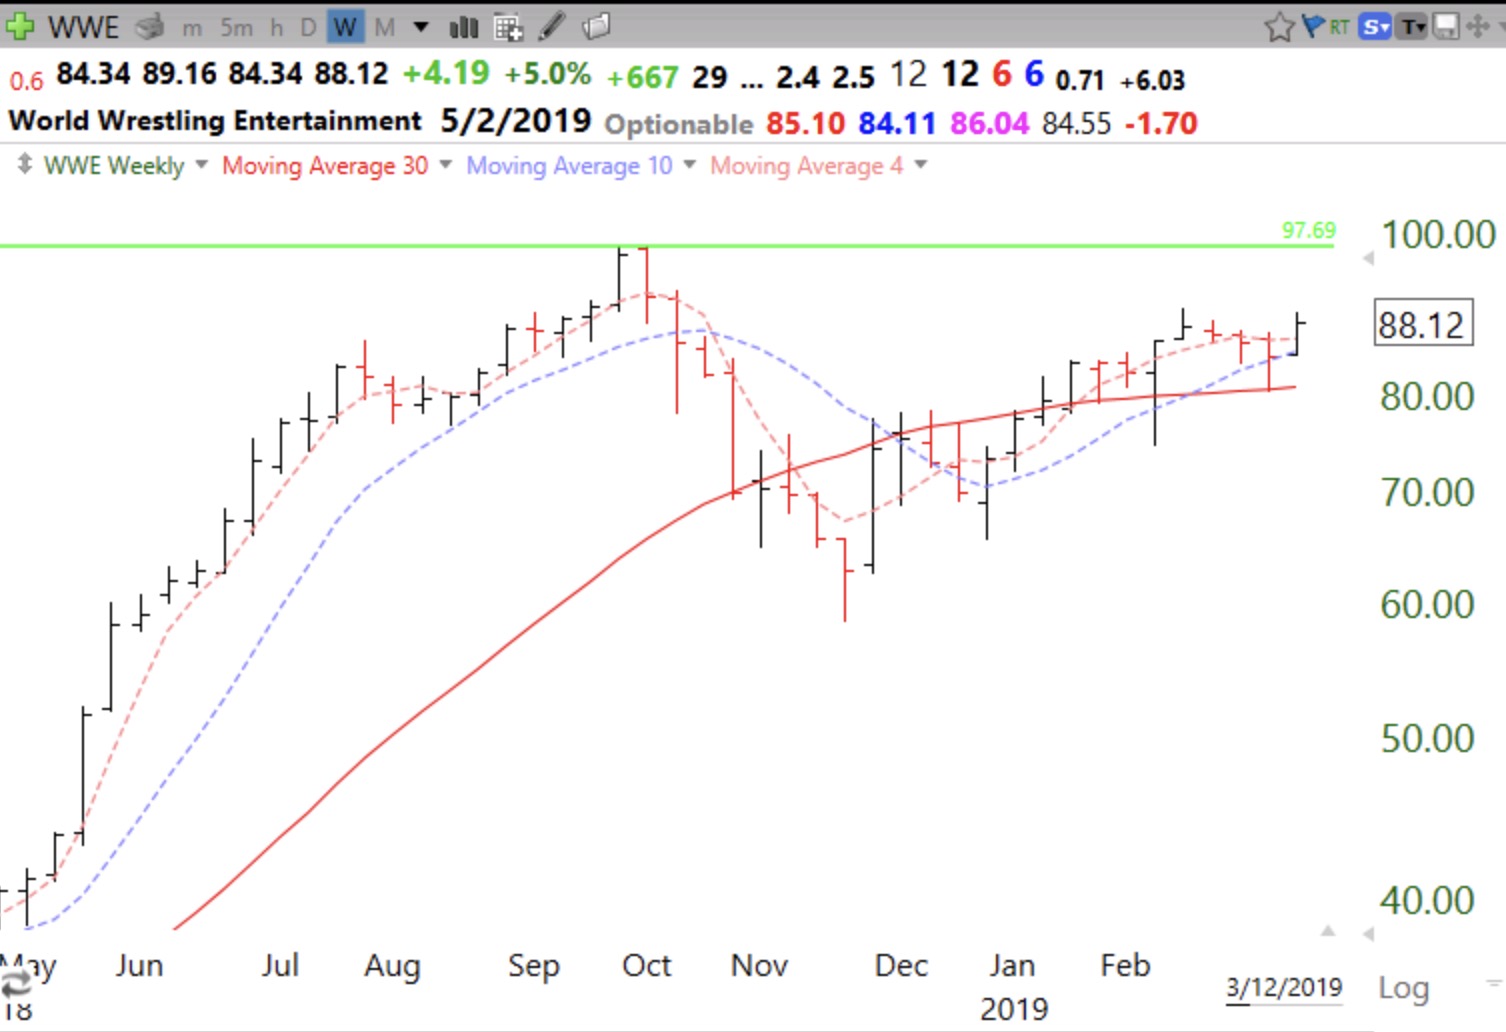
This weekly chart shows a developing cup with handle pattern. Nice support at 10 week average (blue dotted line). Watch for a break-out around 89.65 on above average volume.
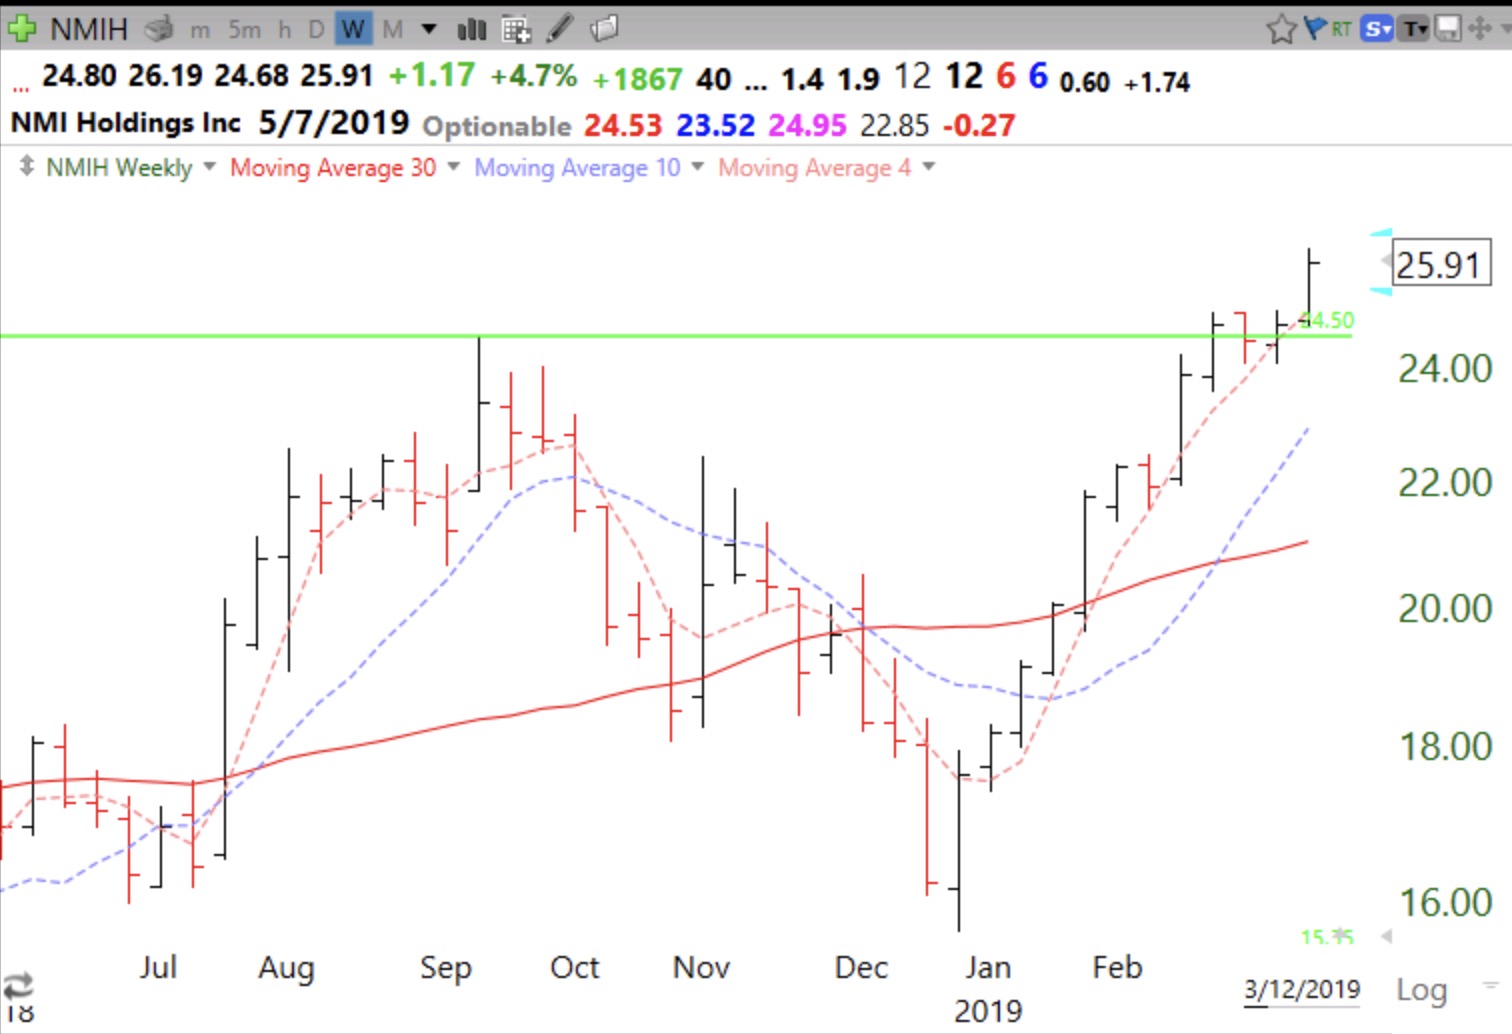
NMIH had a recent GLB (green line break-out).
Stock Market Technical Indicators & Analysis
This weekly chart shows a developing cup with handle pattern. Nice support at 10 week average (blue dotted line). Watch for a break-out around 89.65 on above average volume.
NMIH had a recent GLB (green line break-out).
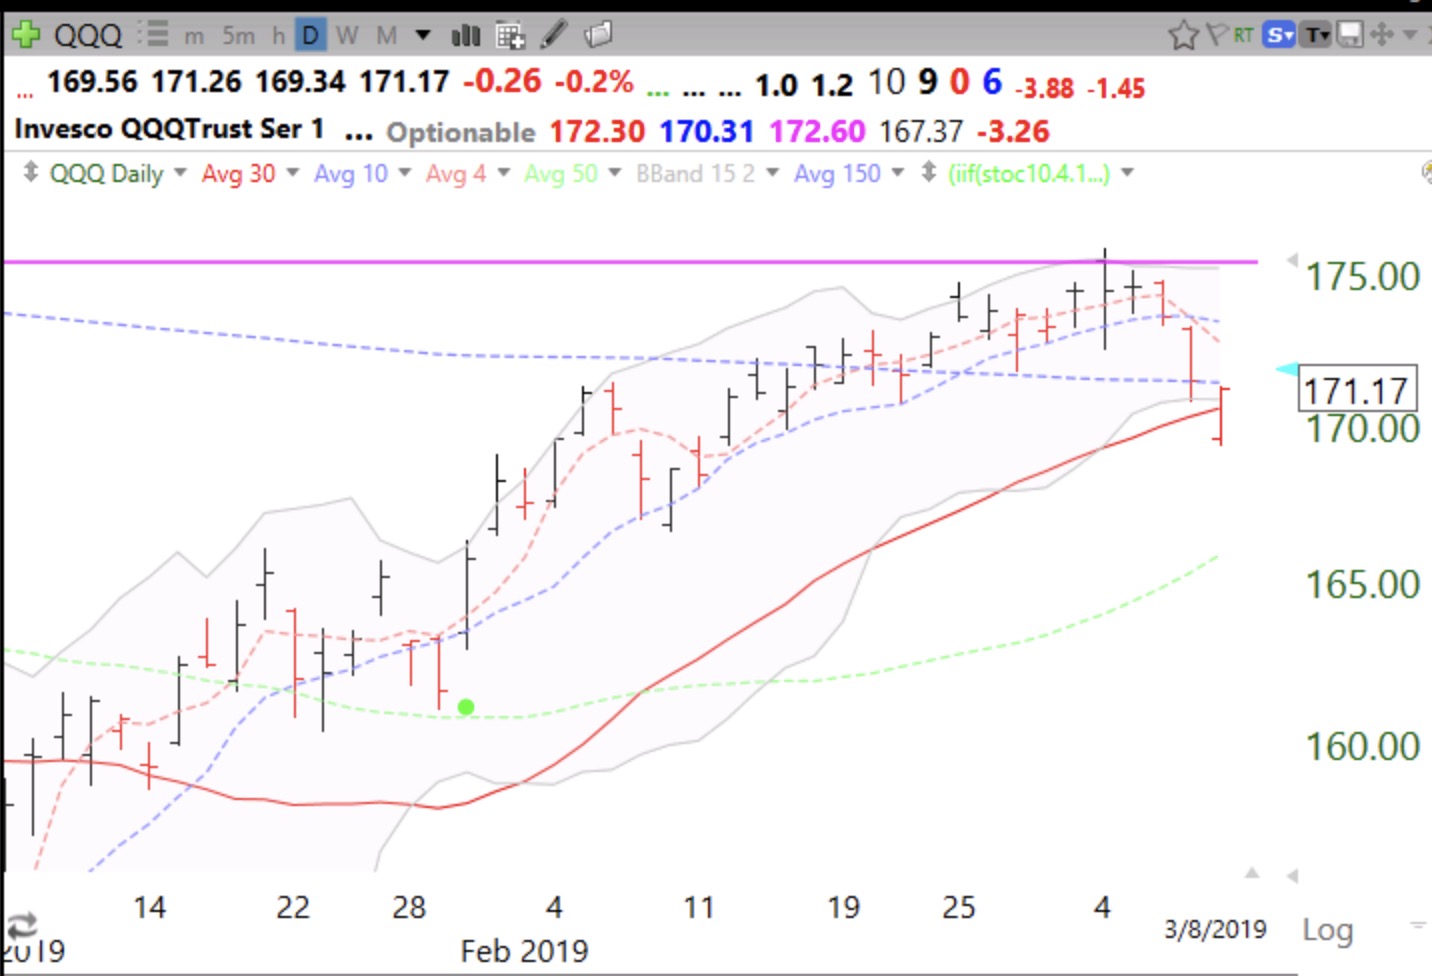
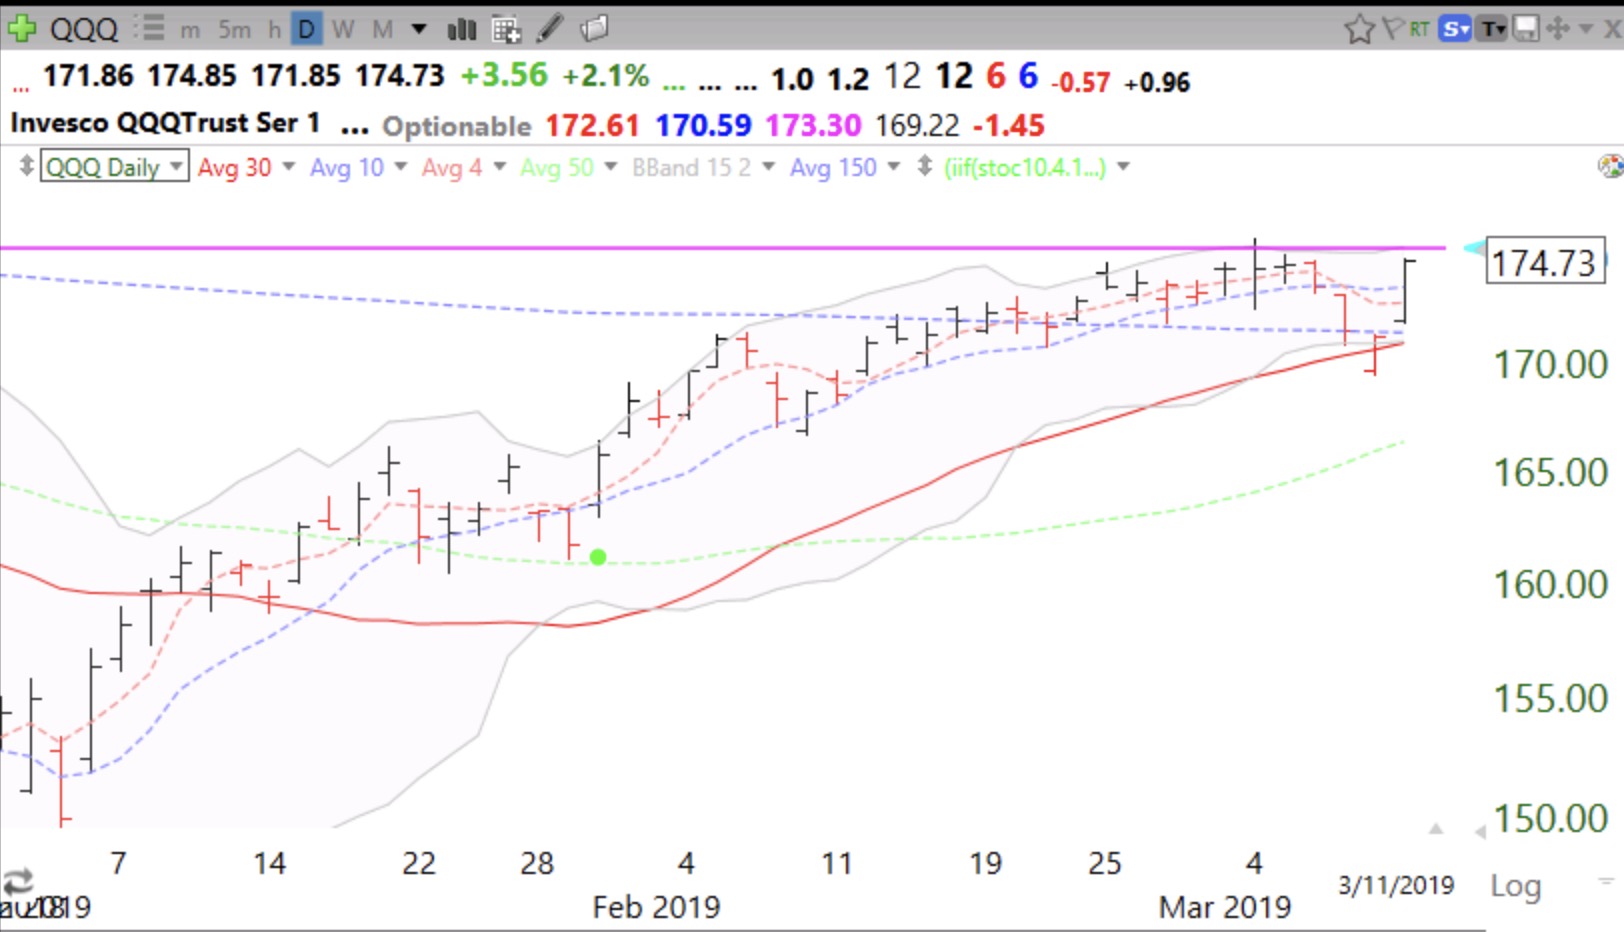
It is looking to me like this brief decline is coming to an end. Many stocks bounced off of support on Friday and moved up on Monday. Look at this daily chart of QQQ. There was a clear bounce off of the lower 15.2 daily Bollinger Band on Friday and a rise on Monday. This pattern was evident in many growth stocks.
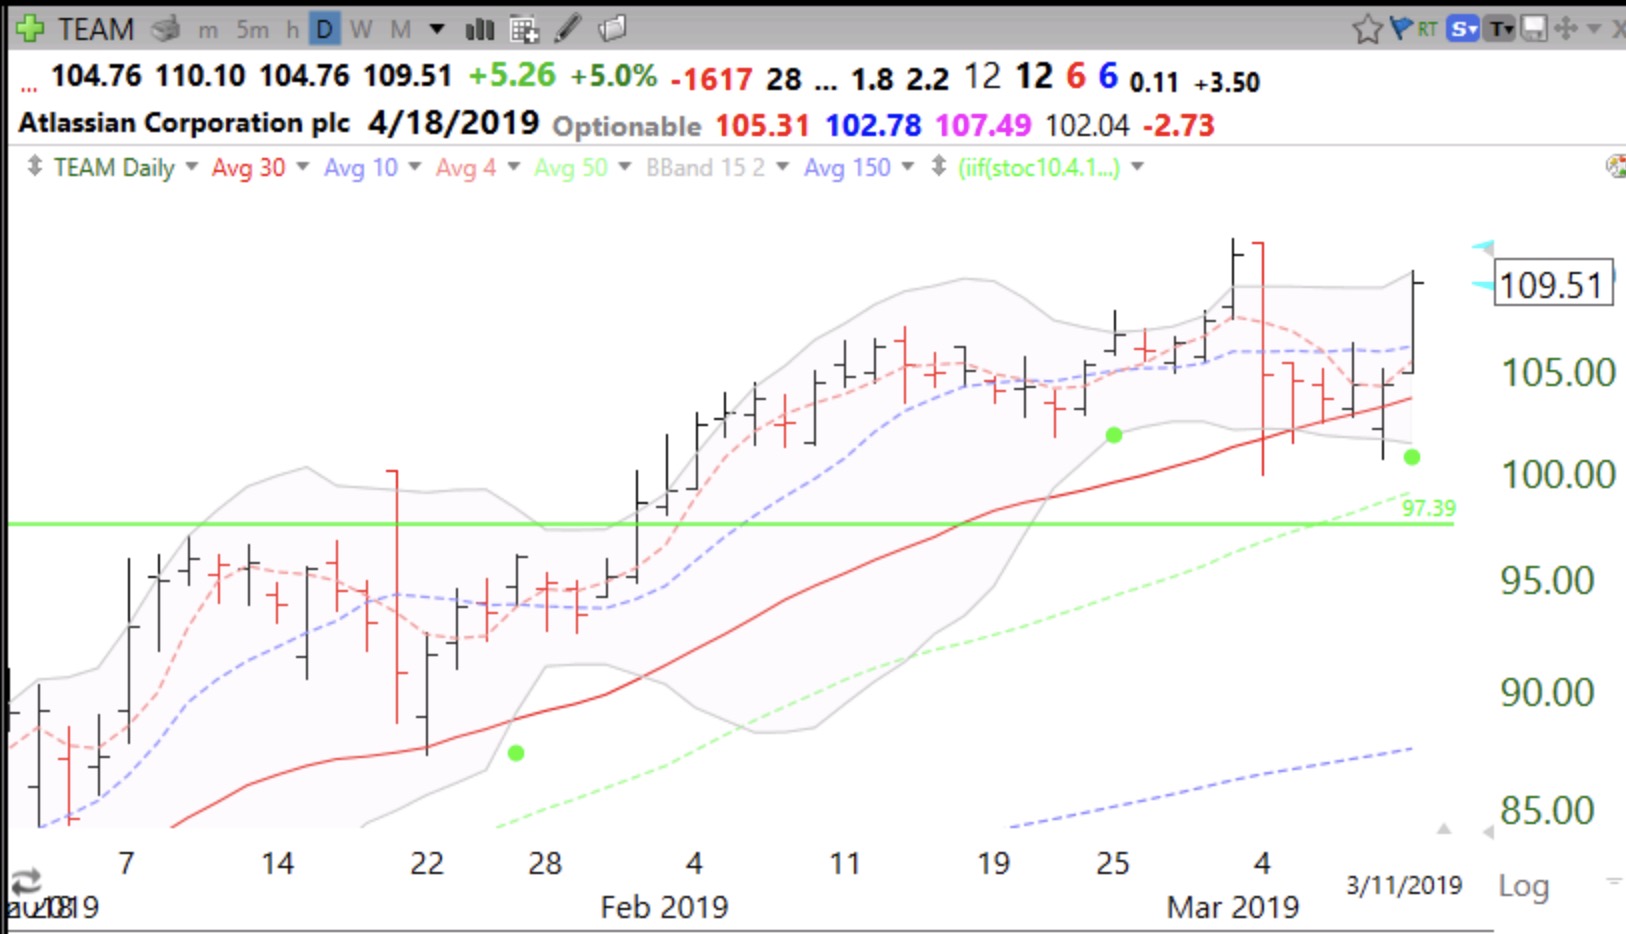
TEAM is a good example. A BB bounce followed by a green dot signal. TEAM is holding its recent GLB.
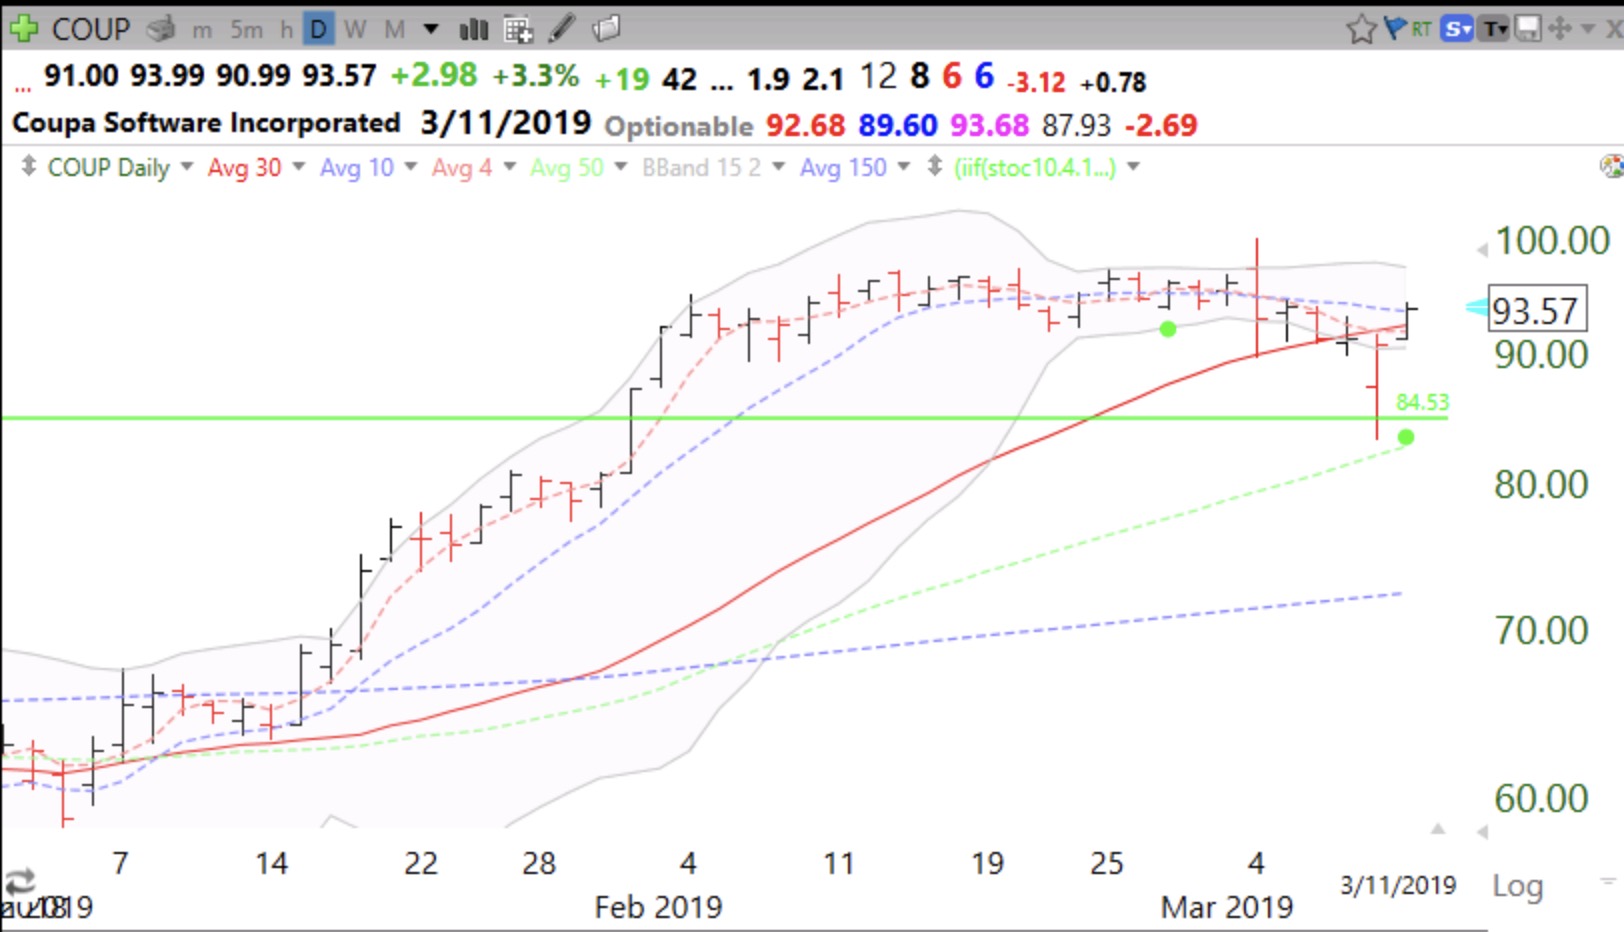
Similar pattern with COUP.
The last time so many stocks touched their bottom daily 15.2 Bollinger Band was last December, just before the recent rally. The QQQ index ETF also did so on Friday. Friday’s low must not be violated.