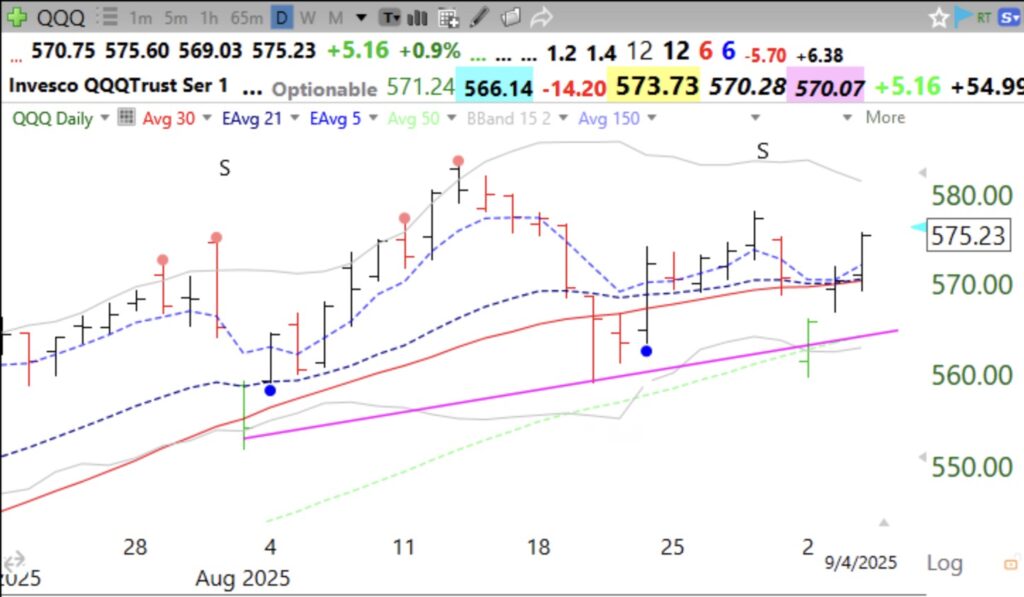
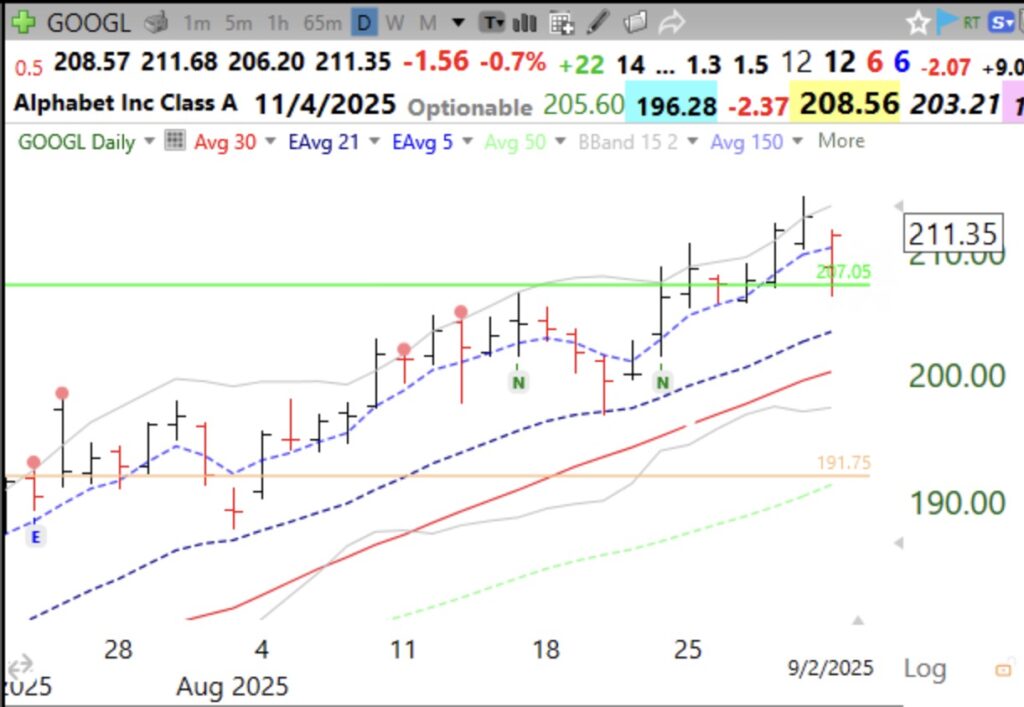
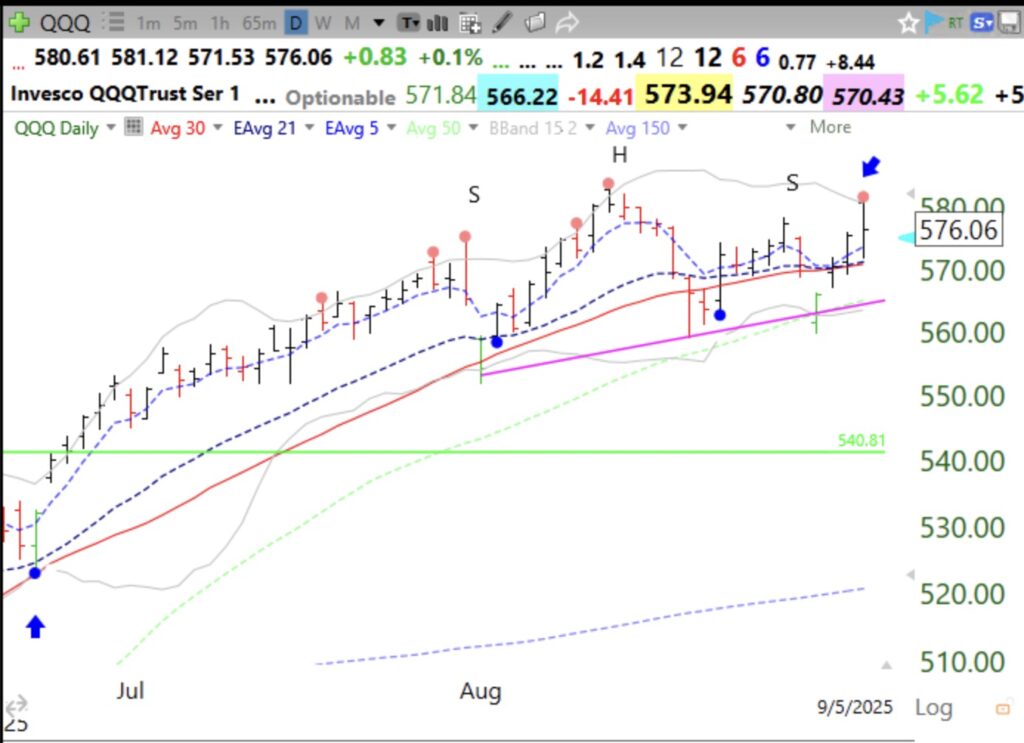
My indictors in the GMI table below are all positive. But why are so many of my setups failing and why is this market so difficult. I think Darvas once said they shoot the generals first and then get around to killing the rest of the stocks. When NVDA and PLTR report good earnings and decline, it makes me worried. Then when I look at the chart of MSFT I see more weakness. AMZN, TSLA and AAPL have failed GLBs. But GOOGL had a recent successful GLB. The economic news is horrible and we have a looming government shutdown at the end of the month. If the Fed reduces rates, it could be seen as confirmation of a weak economy. And then GLD is climbing to the heavens, evidence that people are scared. So what to do? Follow the indicators or just lay low? Look at this daily chart of QQQ. QQQ hit a wall at the upper 15.2 daily Bollinger Band (BB) on Friday. The red dots on this chart mark days when the index bounced down off of the top BB. Will QQQ break through this week? If it does, this market is likely going higher. But note that the upper BB is declining.
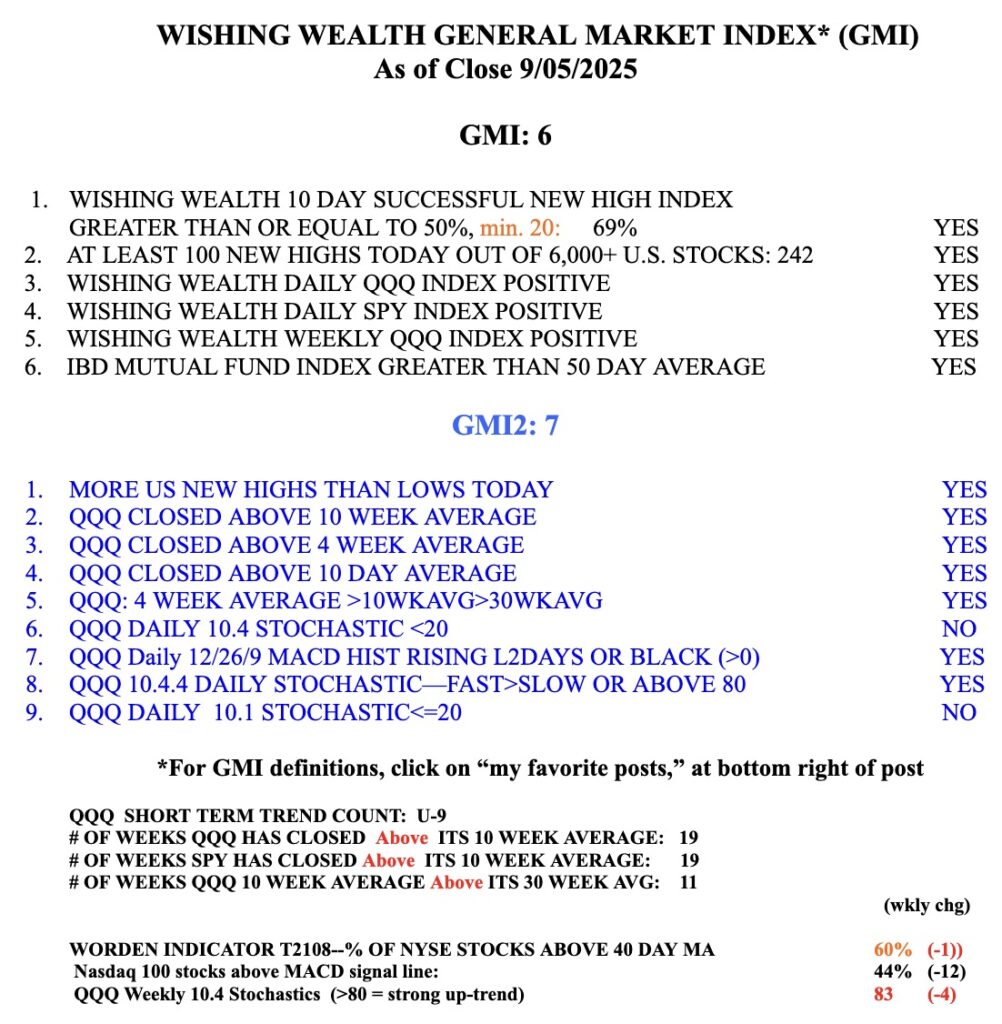
Check out the strong GMI stats. Go figure.