The QQQ held support on Monday but the short term up-trend is in jeopardy. I trimmed back my TQQQ, increasing my hedge towards the down-side. This next two weeks may be very difficult to trade. Time to be very cautious.
Critical week to come; QQQ on support
With the GMI at 5 and still on a buy signal, I would like to remain somewhat bullish. I do not like to pay attention to the news or politics when assessing the market trend. However, we all know that this fiscal cliff hysteria could cause some huge moves between now and New Years. The drop in the QQQ on Friday was large and sudden and formed a gap below Thursday’s range. Friday was the 19th day of the current QQQ short term up-trend. But the up-trend is in jeopardy. This daily chart of the QQQ shows some key characteristics. 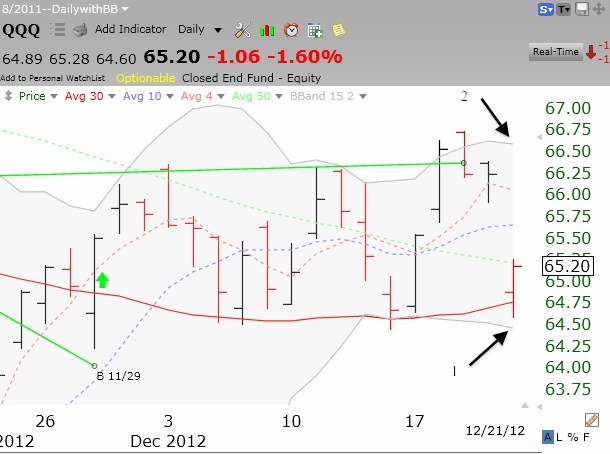 Arrow 1 shows that on Friday the QQQ came close to the bottom of the Bollinger Band range that I follow (15,2) and bounced up off of the critical 30 day moving average (red line). The 30 day average is now rising, an important sign. The gray background highlights the range of the Bollinger Band. Arrow 2 shows the top of the Bollinger Band range where I would suspect any rise might meet resistance. Note that 3 recent rises have stopped at the upper Bollinger Band (BB). Any rise in the QQQ this week will likely meet resistance around 66.60. If the QQQ instead falls through the 30 day average and the lower BB, I would suspect a major decline and begin to exit my long positions. The QQQ is therefore facing a critical test of its short term up-trend.
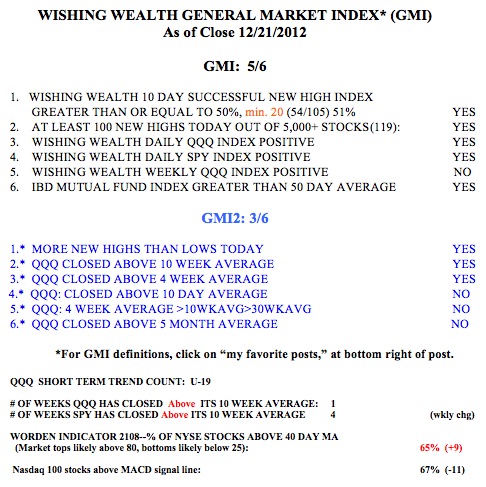
The GMI remains at 5, but the more sensitive GMI-2 is at 3, reflecting weakness. The technically much stronger SPY has closed above its critical 10 week average for 4 weeks, but the QQQ has just crossed above its 10 week average. The Worden T2108, at 65%, is in neutral territory. 67% of the Nasdaq 100 stocks closed with their MACD above its signal line, a measure of short term strength. Extreme caution is called for.
Hedged; LAD: cup-with-handle break-out?
On Thursday, I bought some January call options on the bearish leveraged ETF, SQQQ to hedge my long position in the bullish leveraged ETF, TQQQ. With the news that “Plan B” has failed, the index futures look very weak. My hedged position should reduce any losses resulting from a decline in TQQQ. I hope my readers have also been only cautiously bullish……..
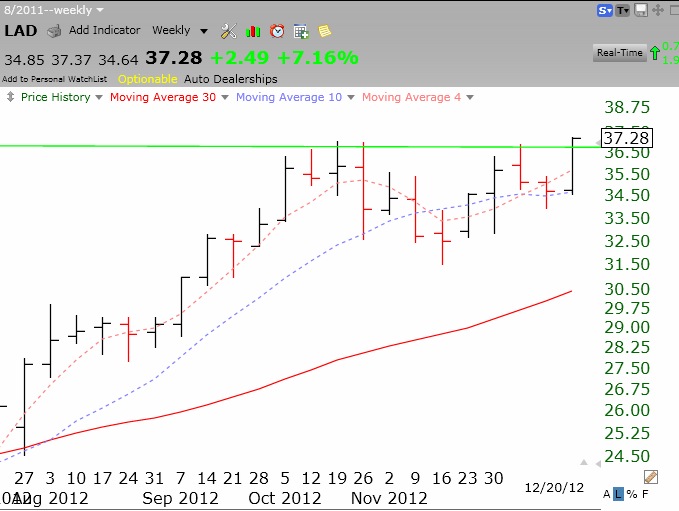
While I would not buy any individual stocks right now, one of the 16 stocks to come up in my TC2000, New High with Good Fundamentals Scan, Thursday night was LAD. It turns out that LAD hit an all-time green-line high on Thursday. This a a break-out above the high reached in 2006. Any stock that can come through a tough market like this and go to a new all-time high is worth researching. The weekly chart below suggests to me that this a a cup-with-handle break-out.
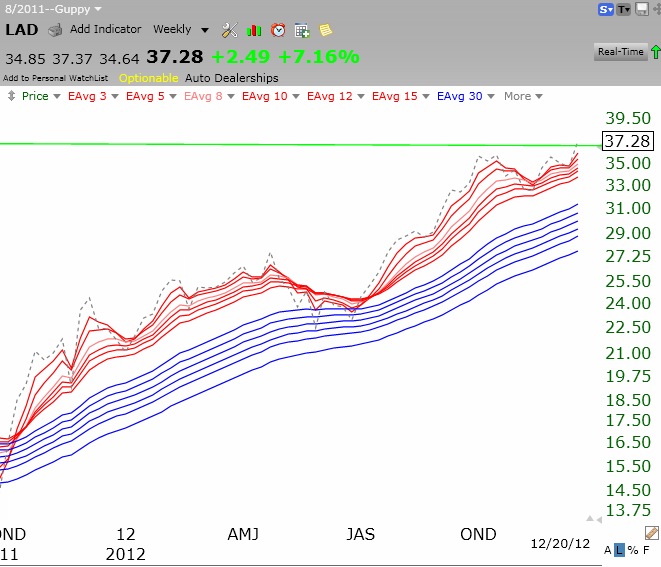
The weekly Guppy chart below also shows LAD to have an RWB rocket stock pattern. Click here to read this interesting article about LAD.
If you want to learn more about how I analyze stocks, see my free Worden sponsored Houston TC2000 webinar by clicking here.