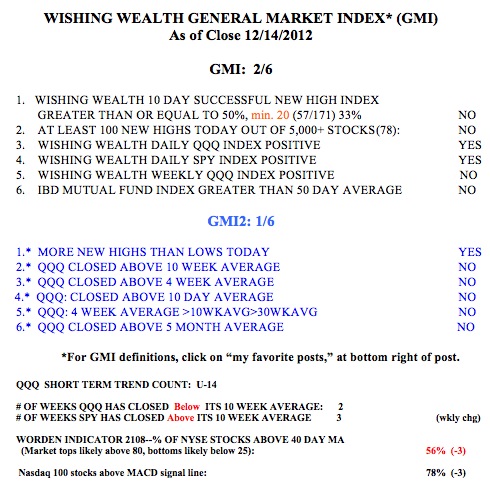
Expected bounce occurred, now what? Gold consolidating? Facebook under accumulation?

GMI0/6
GMI-20/9
T210820%

The market bounced from its oversold condition on Friday.   Market indexes rose on higher volume than the preceding day, a good sign.   IBD still sees the market in a correction and is waiting to see if we get a follow-through day at least 4 days after Friday’s rally. To undertsand the IBD strategy, you must go to their website, investors.com or read their newspaper.

Meanwhile, the GMI remains at zero and Friday was the 28th day of the QQQ short term down-trend.   I noted weeks ago that if the leader, AAPL, could not climb, it was an ominous sign for the market.   AAPL almost reached $500 on Friday and then bounced.   This is a good sign but it will take a while to determine whether the $500 level will hold.   A trend follower does not predict the market, but   follows the prevailing trend. The GMI will flash a buy signal sometime after the bottom is in place. I never expect to get in at the bottom. With the market in a short and long term down-trend it is safest to be in cash or short.   After I can assess the strength of this bounce, I will decide whether to reenter the market on the short side or to wait for more signs of a true reversal. The market is out of the severely oversold status it was in on Thursday, with just 3 of my four oversold indicators positive as of Friday’s close.

I thought you might like to see a greenline chart of the gold ETF, GLD.   I draw a green line top at a monthly peak that has not been exceeded for several months.   Note from this chart that GLD has broken out of several multi-month bases.   However, the last break-out occurred in July 2011, and now GLD has formed a new top.   We need to wait to see when/if the recent top around $185 is exceeded.   Until then, GLD appears to be in a long period of consolidation. I would be concerned if it could not hold the $150 area.   Click on chart to enlarge.

I bought some Facebook   last week for a long term hold.   With a billion users FB must have amazing potential.   Some fund managers must agree   after FB stock has had all of the excess speculation wrung out of it   as it has fallen more than 50% from its IPO.   FB is now showing signs of strength and probable accumulation around $19.   With a major lock-up period ending last week, FB was supposed to fall as millions of original   shares could be sold. But instead, FB rose 22% in a weak market environment. It is also noteworthy that Goldman Sachs is the top holder of FB stock, owning about $1.4 billion worth of its shares as of late June. Maybe they know something? This weekly chart of FB points out 3 weeks of high volume advances since mid-September.   So I bought some FB to hold for months or years, not weeks. I would normally wait to buy until it exceeds its greenline top at $45, but I am willing to bend my rules and to wait for FB to recover. If I am right, then I will average up as it rises. If I am wrong and it closes below the green trend line I drew, I will exit.

Market remains oversold, waiting for bounce

GMI0/6
GMI-20/9
T210817%

80% of the Dow 30 stocks have a daily 10.4 stochastics reading that is oversold–below 20.   This is the highest percentage since I began tracking this statistic last December.   In addition, the T2108 indicator is 17% (lowest since May 18th) and   the put/call ratio closed at   1.16% on Thursday.   A put/call ratio above 1.2% is always followed by at least a bounce.   The QQQ short term down-trend reached its 27th day on Thursday.   The downtrend that ended last June reached 44 days. There were 413 new lows on Thursday in my universe of stocks, the most since October 4 2011, when the market retested a major correction low. IBD still sees the market in a correction.

By now the decline is accepted and appreciated by everyone.   The percentage of advisors that are bullish has come well off of its highs, above 50%, and is now at only 38%.   I closed out my position in SQQQ and am now 100% cash in my trading accounts.   I want to assess the strength of the next   attempt to rally before I take another position.   The closer that T2108 gets to single digits, the more optimistic I become. The GMI remains on a sell signal since October 22.

This weekly chart of the QQQ since 2011 shows the GMI buy and sell signals. Note the low trading volume on this decline, compared with the volume at the August, 2011 bottom. Click on chart to enlarge.

Market very oversold; 26th day of QQQ short term down-trend, SQQQ up almost 30%.

GMI0/6
GMI-20/9
T210819%

My oversold indicator count is now 4 out of 4.   I am looking for a bounce.   For example, the T2108 is at 19%, heading towards an area where a bounce might occur and the put/call ratio was greater than 1.0 at Wednesday’s close.   I am still in cash and a little short. Since October 8, the first day I identified a new short term down-trend for the QQQ, the QQQ has declined -8.9% and SQQQ (3X inverse ETF for QQQ) has advanced +29.9%.   Since the GMI flashed a Sell signal on October 22, the QQQ has declined   – 5.7% and the SQQQ has advanced +18%.   Clearly the short term down-trend signal provided a better entry, but it is less reliable than the full GMI based signal (I think so but have never tested this hypothesis).   The leveraged index ETF’s   perform really well when I catch a multi-week trend move.   However, they can reverse quickly.