GMI: 0; GMI-R: 0; 2,832 new lows on Friday; T2108: 1%; Our embarassing failure to educate youth about the market

The GMI and GMI-R remain at zero.  On Friday, there were 23 new highs and 2,832 new lows in my universe of 4,000 stocks.  This is the largest number of daily new lows since I started this blog three years ago. The Worden T2108 indicator remains at 1%, about as low as it gets.  This is the time to be on the sidelines in cash.  No one knows when this down-trend will end.  Friday was the 29th day of the current short term down-trend in the QQQQ…

It is amazing how Jim Cramer is now claiming to have been urging people to be in cash.  The truth is that he and the other market pundits have been urging people to buy stocks all the way down.  At  no time did any of them say to go mainly to cash.  Cramer has repeatedly ridiculed the use of charts.  But it is the chart patterns that warned me to get out of this market recently, and in 2000.  I started this blog to give the little guy (and gal) a chance to learn  how to discern the market's trend.  When the trend is down one should not be looking for stocks to buy.  One goes to cash or goes short.  There will be plenty of time to ride the next up-trend once it has proven itself….

It is a crime that we do not teach people how to think for themselves when they invest their hard earned money. High schools and universities should require students to attend classes in financial planning and investments. I teach an honors course at the university  and my students have a thirst for knowledge about the market. They often report that my class on technical analysis  is the most practical course they have attended and that it should be required for all students.  Why do we fail to educate our youth about such an important topic?  Think how many of our ageing baby boomers are now looking at greatly reduced assets for retirement. It is painful to me to consider the ramifications of this colossal failure to educate our citizens about how to manage their stock market investments.
GMI: 0; GMI-R: 0; Worden T2108: 2%; But only 1,296 new lows Tuesday

We may be getting close to a bottom or a bounce.  The Worden T2108 is now at 2%, the only lower reading since 1986 was during the October 1987 crash when it reached 0.5%.  This indicator means that only 2% of NYSE stocks closed above their average closing price over the past 40 days.  However, in spite of the large decline on Tuesday, there were considerably fewer new lows in my universe of 4,000 stocks than the day before, 1,296 vs. 2,119.  So, not as much weakness was exhibited on Tuesday as on Monday.

The best strategy is to stay out of the market or to be short.  Even Jim Cramer is now telling people to get out of stocks if they may need to use their funds in the next five years.  But most advisers are buy and hold, value addicts.  By now we should all see that value is a myth in the market.  A stock is only worth what someone will pay for it.  Don't be scared into this market.  We do not need to be in the market all of the time.  Every meaningful up-trend lasts for months, if not years.  There is plenty of time to get back into the market after a bottom is in and a new up-trend proves itself. When the GMI rises to 3 or more it will be time for me to tiptoe back into this market.  And remember that the market, which always looks forward,  will turn while the economic news is still bad.

Thank you again to all who have sent me messages about how they have used the information from this blog to protect their investments.

GMI: 3; GMI-R: 7; buying QLD; Bear Stearns gave plenty of advance warning of its collapse

The GMI rose to 3 (of 6) and the GMI-R to 7 (of 10).  There were 39 new highs and 21 new lows in my universe of 4,000 stocks on Tuesday.  70% of the Nasdaq 100 stocks have now closed above their 30 day averages and 94% of my 16 short term indicators for four index ETF’s (DIA, QQQQ, SPY, IJR) are now positive.  The QQQQ is now in its sixth day of its short term up-trend.  I have closed out my shorts and am accumulating QLD , an ultra ETF that aims to move twice as much as the QQQQ (Nasdaq 100 index)…

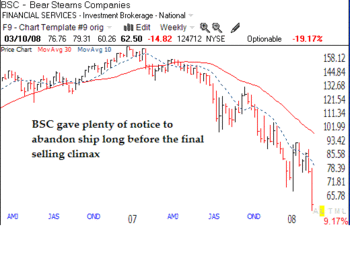
I am  incredulous of the media pundits who claim that the recent plunge in Bear Stearn’s stock to $2.00 was sudden or unexpected.  Bsc
This weekly chart of BSC (click on to enlarge) shows that the stock peaked in January, 2007 and declined below its 30 week average (red line) in May, 2007, a key danger signal.  A few weeks later the 10 week average (dotted line) broke below the 30 week average.  Over the next five months the stock was in a sustained down-trend.  In the week following the last week displayed in this chart the stock collapsed from around $60 to below $10.  The ignorant media focused only on that last week of a selling climax, and missed the point that the collapse was preceded by a long six month down-trend during which anyone who follows technical analysis should have exited BSC or shorted it.  (Cramer hates charts and told his audience not to exit the stock.) A story claiming sudden unexpected selling by nefarious hedge funds must sell more papers…………….