The table below, like the one I showed in late August, shows me the wisdom of forsaking individual stocks in favor of the 2X or 3X ETF”s. Why try to find the few stocks that can beat these ETF’s when the odds are so low? Since the current short bounce began September 1, the standard NASADQ 100 index ETF (QQQQ) rose 8%. 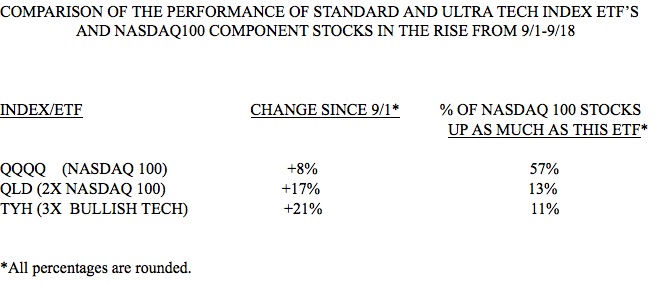 During this same period, the comparable Ultra 2X ETF (QLD) rose 17% and the tech 3x ETH (TYH) rose 21%. If I had been trying to pick the specific NASDAQ 100 stock that would outperform these ETF’s, I would only have had a little better than even chance (57%) of beating the QQQQ. But only 13% of the NASDAQ 100 stocks beat the QLD and 11% beat the TYH. So, why search for the low probability winning stock when I can just buy the Ultra ETF’s? Furthermore, a single stock can be slammed by bad news, but the ETF’s are less vulnerable to that because they represent an index or a collection of stocks. The key to trading profits is to play the odds and not to try to look smart by beating them….. Meanwhile, the GMI and GMI-R remain at their maximum
Darvas
Stage 2 bullish up-trend in sight; Some Darvas type stocks to watch
The market held by the end of last week and I am getting more bullish. This is because we appear to be at the beginning of a significant turn up in the QQQQ. According to Weinstein’s stage analysis, the QQQQ is beginning a Stage 2 up-trend, as shown by the fact that its 30 week average is now starting to curve up. This is the sine qua non (I went to Boston Latin School) of a bull move. Weinstein’s stage analysis (note his classic book, to the lower right) is the most important way for me to determine the trend of individual stocks and the general market. By staying out of the market during aStage 4 declines (like the one we just finished) one can put the odds in favor of one’s portfolio’s long term growth. The GMI, which includes this measure from stage analysis, remains at 4 (of 6).
Rally gaining strength; Guppy chart reveals major turn
If calling the short term trend of the market were easy, we would all be rich and retired. Last week, my short term QQQQ indicator gave me a head fake and turned my daily trend count down. That new downtrend lasted for two days and then the up-trend resumed. However, I had indicated at the time that my short and long term QQQQ indicators were giving inconsistent readings, with the long term indicator remaining in an up-trend. The new short term up-trend just completed its 3rd day.
The more that I analyze the market, the more I become convinced that I should rely on the longer term weekly trends to determine the market trend (see discussion of the Guppy chart below). The QQQQ has been above its critical 10 week average for 11 weeks and the SPY for 10 weeks. But I have told you that I am a chicken, and would rather go to cash at the first sign of weakness and re-enter the market later, after the dust has cleared. I actually have other, personal reasons, for why I am unwilling to enter the market right now. I cannot trade successfully when I am stressed by other concerns. The only stock I own is ASIA, with a close stop loss.