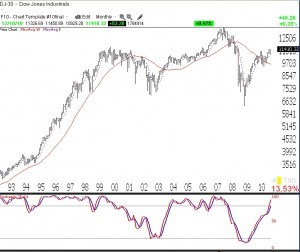
I used my favorite indicators to review the Dow 30 Index’s action since 1915, as this is how far back TC2007 allows me to track this index. I looked at the monthly chart and the following indicators: 5 and 30 month simple moving averages and the 25.4.4 monthly stochastic. I am posting a chart of the Dow 30 since late 1992. A few patterns leap out at me. First, notice how the Dow spent most of the time in the roaring 90’s up-trend above the rising 30 month moving average (red line) and with the 5 month average (dotted line) rising above the 30 month average.  (Click on chart to enlarge.) The stochastic (in the lower window) with two exceptions, spent almost all of the time above the 80% “overbought” level (top parallel line), until it began a steady decline in 1999, foreshadowing the major decline in the Dow. The 5 month average declined below the 30 month average. The bear market bottomed out with the Dow below the declining 30 month average and with the stochastic around oversold territory, near 20% (bottom parallel line). The market turned up, the 5 month average rose above the 30 month average and the stochastic returned to near 80% again. In 2008, the process repeated itself, with the 5 month turning down below the 30 month average and the stochastic declining until it became very oversold again, around 20%. The market has now rebounded, the 5 month average is rising nicely above the 30 month average and the stochastic has just returned to overbought territory, an area where it has stayed for years in some previous rising markets.
So where are we in the current cycle? It looks like we are in a strong up-trend with no sign of any weakening yet. In fact, the 30 month average has not yet reversed up, but the 5 month average is moving up nicely above it. Now I have learned in trading over the past 40 years that patterns are meant to be broken. The road is littered with the carcasses of Ph.D.’s who wagered heavily and lost, based upon complicated mathematical relationships that worked in the past. I can tell you that the simple patterns I have discussed below seem to me to have worked well over the past 95 years. Major bottoms in the Dow have occurred with this stochastic below 50% and the more severe ones, around 20%. So, I won’t begin to suspect the end of the current up-trend until I see the stochastic turn down and the 5 month average decline below the 30 month average. I’ll let you know when that happens…….
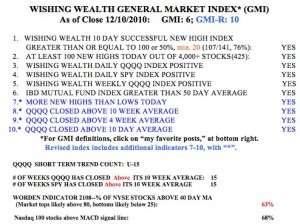
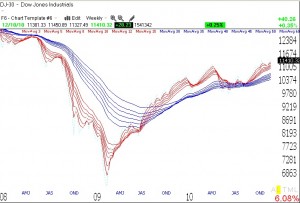
Meanwhile, my General Market Indicator (GMI) remains at the maximum reading (6 of 6) and the more sensitive GMI-R is at 10 (of 10).  Thus, all of my short term and longer term indicators for the QQQQ (Nadaq 100 tech stocks), and the SPY (S&P 500 stocks) remain positive. The QQQQ and SPY have closed above their critical 10 week averages for 15 straight weeks. However, Friday was only the 15th day of the QQQQ short term up-trend. The Worden T2108 Indicator is at 63%, in neutral territory. And 68% of the Nasdaq 100 stocks closed with their MACD above its signal line, a sign of short term strength. The weekly GMMA chart below shows that all of the short term averages (red) are above the rising longer term averages (blue), reflecting an established up-trend. So with my more conservative funds, I am adding to my positions in the major index ETF’s like QLD, SPY and DIA, a comfortable way for me to ride the up-trend.

