The Downtrend Continues?

“Want to know how to make a small fortune in the stock market?
Start with a large fortune!”

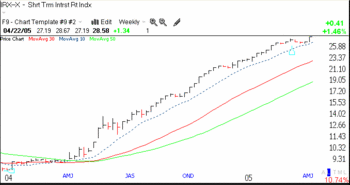
I thought you would probably want me to back off of the strategy discussion (see yesterday’s post) and to return to my take on the market.   A number of people have written to me about going short.   This interest, together with the skepticism about the market’s rally in the media cause me to pause, just a little.   However, I do not reverse direction until my market indicators start to change. So, I wait, mainly in cash and put options in my IRA.   (I did sell my one small long position, MHS–I got tired of holding anything at odds with the general market trend.) The attached chart (click on it to enlarge) Irxx shows the consistent rising trend in short term interest rates that started in May, 2004. (I have asked the TC2005 support staff at Worden.com to tell me the basis for this index, and will report back on their answer.) The Fed’s persistent pressure on rates is one of the obstacles to a rising market.   Historically, in its fear of inflation, the Fed typically misjudges how much to put on the brakes and eventually brings the market and the economy to a screeching halt.   (In spite of this track record, traders tend to delude themselves into thinking that this time will be different and we will get a “soft landing.”) This short term interest rate index has been hugging its rising 10 week moving average for months, and just bounced off of the average to a new high, after a few weeks of a plateau.   This renewed rise is not a good omen.   A consistent reversal in this index will probably foreshadow a subsequent bottom in the market–but not immediately.   So, we will keep an eye on this index.
IBD’s Monday edition published a put/call ratio of   .86.   This means that 86 puts were traded for every 100 calls.   (Puts are options that gain when the underlying security falls; calls gain as a security rises.   In other words, puts are bets by option traders that a security will fall, calls are bets on a rise.   Did I imply that people are gambling?)   This ratio is a contrarian indicator, which means that it typically predicts the opposite type of   market movement than would be expected from the trades.   If an extremely high number of option traders are bearish (buying more   puts than calls) then the market often tends to rise, at least short term.   People are most scared at bottoms and overly optimistic at tops.   Most of the time, traders are more bullish than bearish and the p/c ratio is below .80.   When it stays above .80 for a while and gets above 1.0, the market usually is in store for a bounce.   The current ratio is not at an extreme.   However, if it breaks 1.0 this week it may signal short term   strength in the market.   If the P/C ratio   starts to trend lower in this depressing environment, say below .60, watch out below!

I am short some housing stocks.   It is rare that I find so many companies in an industry with the charts looking so sick.   Here are a few, in no special order:   RYL,OHB,LR,LEN,MDC,MHO,DHOM,WCI,SPF,DHI.   I did not run out of ugly symbols, but you get the picture.   Even   lofty NVR appears to have broken its uptrend on a number of large volume declines.   Is it too late to sell these?   Who knows, but the current trend is obvious to me.   Could insiders possibly be showing us something about the future of housing?   Watch behavior,   not words.

I hope you have a good trading day tomorrow.   The trend is your friend.

WishingWealth 10 day successful new high index:   4/22 19;   4/21   28;   4/20   12 (for definition, see Madness post)

Let’s Talk Strategy

“it is utterly useless for us on the outside, who buy and sell comparatively small blocks of stock, to conjecture about what “they” are doing.   We cannot know what the insiders intend to do, but we can see their orders on the tape when they execute them.   That is why my plea is for everyone of us to have no mere opinions of his own, but to allow the actions of the market to tell him what is passing.”
(Humphrey B. Neill, Tape Reading & Market Tactics, 1931, New York: B.C. Forbes Publishing Company; 14th printing, 2003, Vermont: Fraser Publishing Company)

When Nicolas Darvas was interviewed by Time Magazine in the early 60’s and it came out that he made almost 2 million dollars in the market in 18 months (while he was dancing around the world!), he noted that he read and reread Neill’s book (along with Gerald Loeb’s).   Neill’s book has been reprinted many times and I happened to find it on the shelf of my local Barnes and Noble store.   Neill dedicates his book, “to my losses, with a deep appreciation for the experience and knowledge which each loss has brought me.”

Read more

STOP THIS MADNESS

I exited the market in the fall of 2000.  I became incensed  as the NASDAQ was falling over the next 2 years and the media pundits were telling  us to buy and hold and to go after the bargains.  Day after day they were wrong and yet people continued to listen to them.  I remember one adviser who recommended Exodus Communications when it was down to 65 from the 80’s, and continued  praising its virtues all the way down until the company was finally de-listed.  And yet this person had the nerve to come back each week and opine on the market and to offer his picks.  The tragedy was that many persons lost their savings and their plans for early retirement. 

So has anything changed since then?  Today, in spite of the strong downtrend in the general market, the media gurus of the day are looking for safe stocks to buy–the few defensive stocks that will hold up.  Maybe they would lose their audience if they came out and told people to sell their stocks and stay in cash, never mind sell short.  They just keep telling us to look for the safe stocks–the needle in the haystack. But the bear devours everything before it is through.  Why do they insist on fighting the trend?  I certainly will not–the decline continues.  Over the years I have noticed that the market seers do not declare a bull or bear market until about 6 months after it has begun.  The NASDAQ topped out in January and the DOW in March.  When will we hear the first declaration of a bear market from the talking heads?  Stop this Madness.

My short positions made money today.  The housing stocks continue to crack.  This is probably just the beginning.  My lone long, MHS, did not hold up well today.  I may be stopped out tomorrow.  Over and over, I learn that to fight the trend is folly.  Don’t buy stocks now–any stocks.  I am mainly short and in cash.  Nothing feels better than to be in synch with the trend.

My primary trading strategy is to buy growth stocks trading at or near new highs.  I rode Yahoo up 100 points on two occasions and sold out above 400.  I buy high and sell higher.  But a hard lesson to learn is that the strategy that does beautifully in a bull market fails miserably in a bear market.  (Check out the book by Nicolas Darvas, How I made………, for a nice description of this phenomenon.) A good indication that things are souring is when the types of trades I have been profiting from suddenly produce a string of losses.

There are several other indicators that tell me when my growth stock strategy is unlikely to work.  First of all, if there are not at least 100 stocks on the NYSE or NASDAQ that are making new 52 week highs, the market is not strong enough.  These days, new lows are more common than new highs–a very bad sign.  Second, IBD (Investor’s Business Daily) publishes a chart each day of  the IBD mutual fund index.  This index tracks the performance of 23 growth mutual funds.  I have found that if this index is below its 50 day moving average, then I cannot make money trading growth stocks.  In other words, if the pros running these funds cannot make money I will not.  These managers are the ones who drive these growth stocks higher with their huge resources.  Currently, the IBD index is below its 50 day average and even in jeopardy of penetrating its 200 day average.  (The 50 day moving average is simply the average of all closing prices during the past 50 days.  It changes or moves each day as a new close is added and the oldest close is dropped.)  As of Wednesday, the index was down 6.15% for the year. In this climate do we really want to risk our money buying growth stocks?

I have also used TC2005 (go to Worden.com to learn about this impressive charting program) to compute a new index of the strength of stocks that are hitting new  highs.  I scan each of the 4,000 stocks in my stock universe (active stocks trading above $5) and count the number of stocks that hit a new 52 week high 10 days ago that have closed today higher than they closed 10 days ago when they hit the new high.  If stocks that hit new highs cannot continue rising, the future for new highs is bleak.  When I first computed this index in March, I found that over 100 stocks met these criteria.  Today, there were only 12 stocks out of 4,000 that hit a new high 10 days ago and closed higher today than 10 days ago.  With odds of 12/4000, why would anyone seek to buy stocks that are hitting new highs with the expectation of seeing them climb higher? I will continue to compute this index and report on any significant changes.

Before I close, let me share with you my thoughts about another ploy for scaring people from getting out of the market.  Ever read those analyses that say that if you were out of the market during the "X"  days of biggest gains, you would have missed most of the bull market move.  I think most people accept this logic at face value.  But I think it is absurd.  For example, say the market climbs 100 points in one day and you were out of the market.  The market could decline and retrace much of that move  on the subsequent days or weeks, when you could have bought in.  You did not necessarily lose the full 100 points.  Furthermore, given that we cannot predict the market’s daily moves, who in  the world would be so unlucky so as to miss all or most of the days of big moves?  I stay out of the market during times like these or go short.  There is always time to catch a genuine bull move.  Am I missing something here?

Send me your comments and questions.