The market was pretty much unchanged Thursday, but the GMI declined to +2. 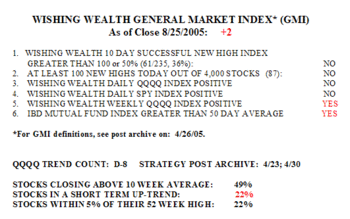 This is because there were only 87 new yearly highs in my universe of 4,000 stocks. 67% of the Nasdaq 100 stocks advanced, along with 65% of the S&P 500 and 53% of the Dow 30 stocks. The percentage of Nasdaq 100 stocks closing above their 30 day averages declined to a new low of 29%. On July 19 the number was 78%. Only 61 of the 235 stocks that hit a new high 10 days ago closed higher Thursday than 10 days earlier. Only 22% of stocks are in a short term up-trend. This is the 8th day (D-8) in the decline of the QQQQ index ETF.
I added a new indicator to the table today. It measures the percentage of stocks in my universe that closed within 5% of their 52 week high. The number is 22%. Put another way, 78% of stocks are more than 5% below their 52 week highs. I think this indicator will provide another measure of the strength of the market and the likelihood of seeing stocks break to new highs…………………..
I can’t count the number of times I have bought puts on the housing stocks only to find them turn up again. 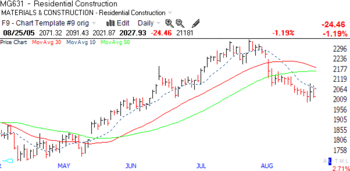 But I think they may really be topping out now. Look at this chart of the residential construction sector. Note that the index is now below the 10 day, 30 day and 50 day averages. The 10 day (dotted line) is now consistently below the 30 (red) and 50 (green). This chart pattern is similar to a host of housing stocks such as: BZH, PHM, LEN, RYL, KBH, MDC, DHI, TOL, CTX, MPH, HOV, to name only a few. All of them have shown volume spikes recently on down days. Even TOL, a Cramer favorite, could not retain its gain on good news and reversed to close down near its daily low on Thursday on unusually large volume. This may only be a correction in housing, but it is consistent weakness among all of the leaders. Is the roof finally about to cave in?
Please send me your feedback at: silentknight@wishingwealthblog.com.
