The GMI remains at zero, although the Weekly QQQQ index is too close to call. 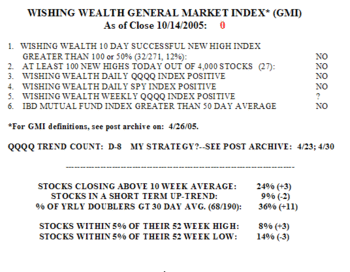 Friday was the eighth day in the QQQQ decline (D-8). While things look pretty bearish, there were some signs of market strength. There were 27 new yearly highs in my universe of 4,000 stocks on Friday, up from just 8 on Thursday. There were still more new lows, 110, however. But between 70-80% of the stocks in the Nasdaq 100, S&P 500 and Dow 30 indexes rose. This was the highest percentage of advances in the S&P 500 since September 9. The percentage of stocks that have doubled in the past year and closed above their 30 day averages increased 11, to 36%. And the percentage of stocks within 5% of their 52 week highs increased 3, to 8%. It may be that the formerly strong stocks are beginning to recover.
The WPM shows only a few changes since last weekend. 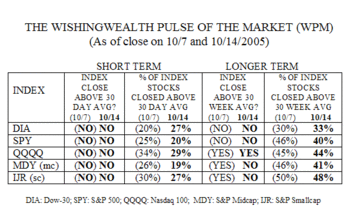 The S+P midcap and smallcap indexes are now below their 30 week averages. The QQQQ is the only index that is above its 30 week average–barely. None of the five indexes closed above their 30 day averages. In terms of the component stocks for the five indexes, the largest changes occurred for the midcap stocks, with only 19% (-7) of these stocks closing above their 30 day averages and only 41% (-5) above their 30 week averages. The Dow 30 stocks showed a little bit of improvement. The eight Dow 30 stocks above their 30 day averages are: IBM, BA, AIG, WMT, UTX, GE, JNJ, and C.
While the GMI and WPM indicate confirmed down-trends in U.S. stocks, it is important to be ready to react if the rally on Friday continues this week. There are some signs of strength that should not be ignored. First, we are entering the end of year, a season when the markets tend to rise. Second, the put/call ratio broke above 1.00 one day last week, indicating that people were buying more puts than call options. This means that traders are betting on a decline in stocks. When the put/call ratio goes above 1.00 it often signals at least a short term bottom. The ratio of actual shorting of stocks by the public versus the specialists on the floor of the NYSE is at very high levels (5-year high of 4.67 on 9/23, according to IBD), again indicating that the public is almost five times more likely to be betting on a decline than are the pros on the exchange floor. Which side would you rather be on–that of the pros or the crowd? Finally, on Friday, Cramer called a bottom for the current market decline–does he represent the crowd or the omniscient insiders? Cramer thinks the pessimism (i.e., selling) is overdone, but I seem to remember that all declines and advances go far beyond what people think is justified. The Investors Intelligence poll of investment advisors now stands with 45.8% bullish and 29.2% bearish. While the percentage of bears is moving up, there are clearly a lot of bulls to be converted. Check out this chart of the NYSE % bulls for an idea of the cycles and how much further sentiment could decline.
So, the bottom line is that this is a very tough market. No one, perhaps except Cramer, can discern a change in trend before it has happened. I guess where I come out on all of this is to be short or in cash, but to be ready for a real change of trend, if it happens on sharply increased trading volume. But remember that the indexes can retrace a lot of their recent declines without breaking their down-trends. It never pays to be married too long to one trading scenario.
Please send me your feedback at: silentknight@wishingwealthblog.com.
 The number of 52 week highs rose to 40, although there were more new lows (95). Between 53-62% of the stocks in the Nasdaq 100, S&P 500 and Dow 30 indexes advanced on Monday. Only 8% of the 4,000 stocks in my universe are in a short term up-trend, down from 50%+ in mid-September. In contrast, strength is evident in the 194 stocks that have doubled in the past year, with 44% now above their 30 day averages, up from 25% last Thursday. It appears that the stocks rebounding now are those that have been most strong over the past year. The top 11 of these stocks, which also had last quarterly earnings up at least 50% are: NTRI, PRLS, KNDL, TIE, MAIN, NDAQ, NGS, GMXR, ASF, ARD, KNOT.

