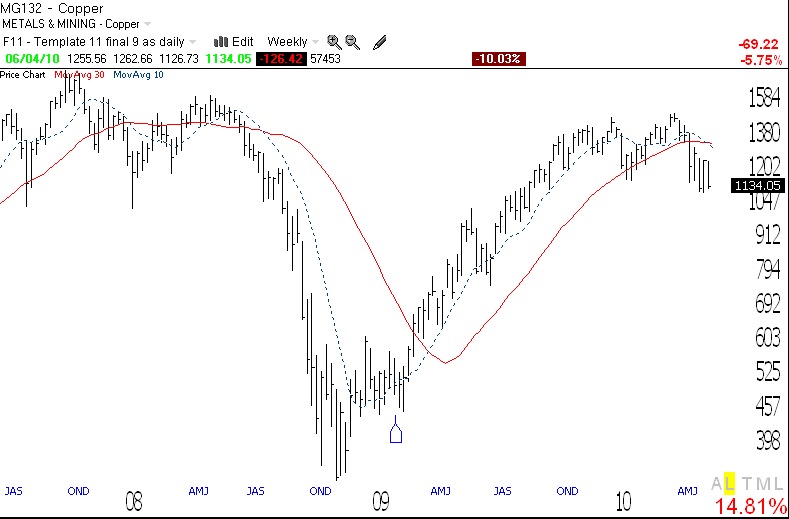
So many of the indicators and stocks I look at are looking very weak. A lot of people say that copper prices are correlated with economic growth. Copper is a key material in so many products related to building and economic development. While looking at my watchlist of indicators, I happened to see this weekly chart of copper.  By my analysis, copper looks like it is getting ready to enter a major Stage 4 (See Weinstein book below for a discussion of stage analysis) down-trend. I can’t trade futures in my IRA account and I can’t short stocks. But I could buy some put options on SCCO, whose chart tracks the price of copper quite closely. Regardless, I think that this chart of copper is an ominous sign for the world’s economy…..
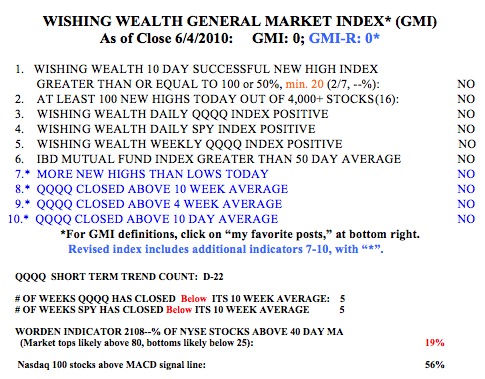
Another ominous sign is that the GMI and GMI-R are each at zero. The markets are in short and longer term down-trends and it makes no sense to hold stocks or long positions now, except for gold (GLD). So I am short a few index ETF’s and own GLD. I do not know how long this decline will last, but things do not look good right now. Friday was the 22nd day of the current QQQQ short term down-trend. The Worden T2108 is at 19%, which is in oversold territory but not at an extreme level. One promising sign is that 54% of the Nasdaq 100 stocks had their MACD above their signal line, a sign of short term strength.
Anyone hanging on to long positions probably has an addiction to trading or gamboling. One needs to have a plan to minimize market risk. It is so much easier to make money owning stocks when the GMI is above 3.