Going long—FFIV and other Darvas Scan stocks

GMI6/6
GMI-R10/10
T210883%

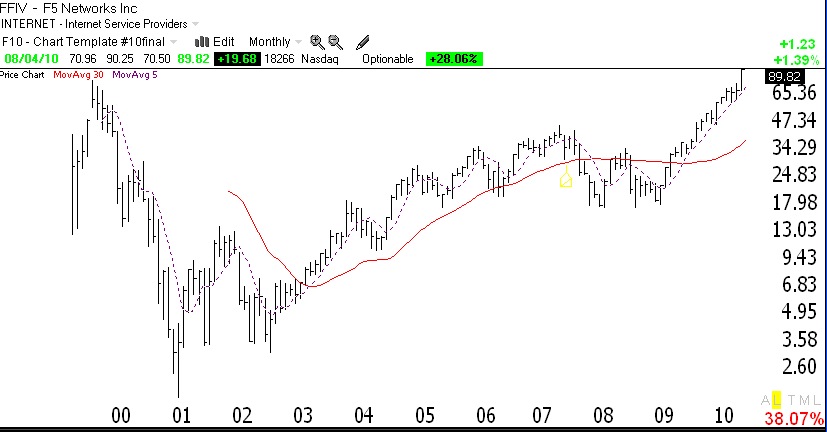
Now that the GMI is 6 and many stocks are hitting new 52 week highs again, I am looking for strong stocks to buy.   As you know, I prefer to buy stocks that have already doubled in the past year and that are trading at or near their all-time highs.   I also want the stock to have appeared on the IBD New America or IBD100 list.   FFIV meets all of these criteria.   It is also a concept stock selection of my talented stock buddy, Judy.   The weekly chart has the technical characteristics I look for, although the stock is extended on a daily basis. Finally, the stock appeared on my Darvas Scan that identifies stocks that have many of the attributes he liked. Below is the monthly chart of FFIV showing that the stock has recently burst through its all-time high reached in late 1999. (Click on chart to enlarge.) I purchased a little of FFIV and will add to it if it keeps rising.   Other stocks that appeared on Wednesday night’s Darvas scan include:   OPEN, APKT, VIT, BIDU, NTAP, ARMH, HWK, GSIT and IDSA.   I own some of these.   Please do not ask me to post my Darvas Scan.   In the future I will post promising stocks that come up in my scans.

How my “oversold stochastic followed by a buy signal” scan found PCLN

GMI6/6
GMI-R10/10
T210882%

I have been talking about the scan that I use to detect stocks with an oversold stochastic that then go on to produce a buy signal.   While I did not buy PCLN when I saw this signal because of the low GMI   reading, I did notice PCLN when my scan detected it weeks ago.   This is of some note, because PCLN exploded after hours on Tuesday when it released its blow-out earnings.   The chart below shows why my scan detected PCLN (click on chart to enlarge).   Within a few days after its stochastic declined to oversold levels, below 20, PCLN closed above its 30 day average, indicating a buy signal for me.   You can see for yourself what happened next.   This scan does not typically work so well in a down market, but I have found that in an up-trending market it can work quite well.   In the coming days I will list some stocks that are picked up by my scan. Just remember, no technique is perfect and one must always use stops to minimize losses.

Dow up-trend looks real

GMI6/6
GMI-R10/10
T210884%

The GMI is now at 6 (of 6) and the GMI-R is 10 (of 10).   The daily GMMA chart of the Dow below (click on chart to enlarge) shows that all short term averages (black) are now above the longer term averages (red).   Time for me to wade slowly back into this market.   Getting ready to sell out my UNG if it declines below 7.80 on Tuesday.