GMI falls to 2; extreme caution needed; protecting capital

GMI2/6
GMI-R2/10
T210854%

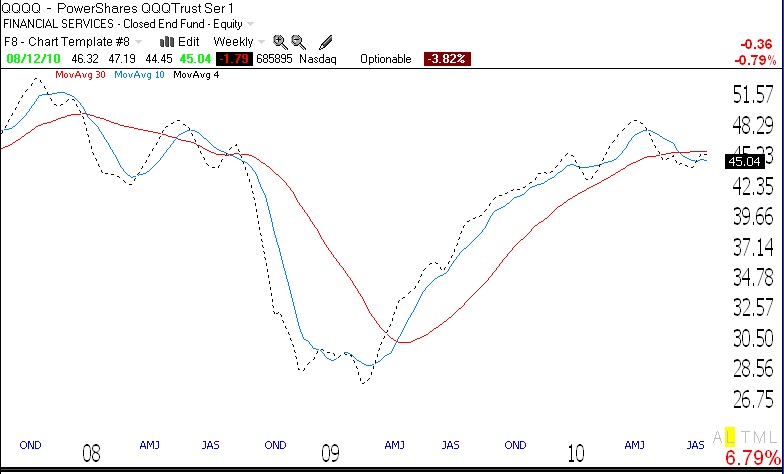
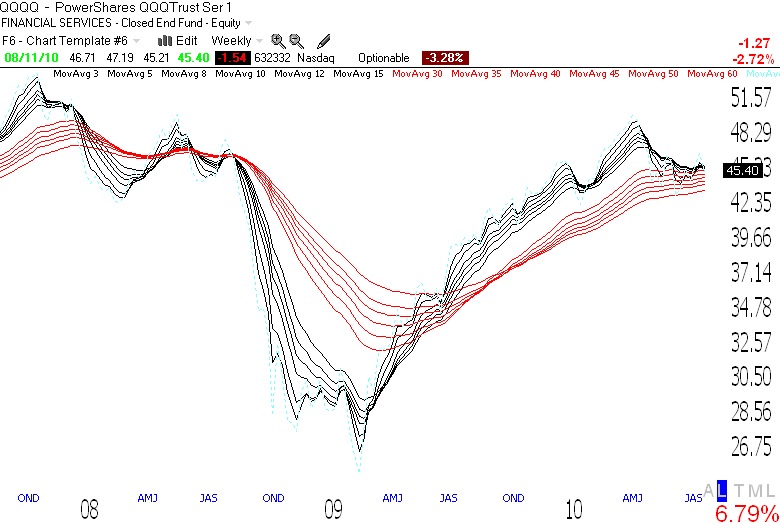
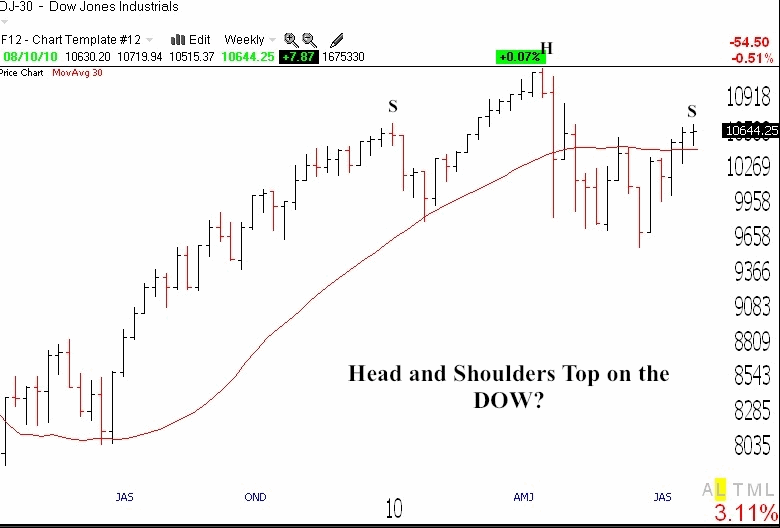
The GMI and GMI-R are each registering 2. Don Worden wrote Thursday night about a possible head and shoulders top, as I did 2 days ago.   I am not yet ready to call a top.   It will take a few more declines to convince me.   But with a GMI of 2, it is prudent to be defensive and to raise stops and cash.   With two of the bull market leaders, NFLX and PCLN, hitting   new all-highs on Thursday, it is hard to say that the bull is dead.     We could just as easily be setting up a head and shoulder’s top as a bottom!   The market has bounced around in a range for quite a while.   The chart below (click on to enlarge) shows the weekly plot of the QQQQ and its 4,10 and 30 week averages.   If we look at the prior recent tops, one can see that the 4 week average typically falls below the 10 and the 30 week averages and leads the decline. At the present time, the 4 week average (black dotted line) is above the 10 week average (blue) and below the 30 week average (red). As long as the 4 week average remains above the 10, I am not ready to call it a major down-trend.   Still, there is no reason to be brave when the market averages look like this.   Better to conserve my capital until things look better.

GMI falls to 3, GMI-R to 4; long term trend indicator negative

GMI3/6
GMI-R4/10
T210857%

In spite of the bad numbers on Wednesday, the short term up-trend in the SPY and QQQQ remains up.   A couple of more declines could change that.   Nevertheless, my longer term indicator is now negative again.   As I said yesterday, the key is whether the 30 week average starts to curve down.   For now it is flat and could yield a lot of whipsaw moves.   Note the weekly GMMA chart of the QQQQ below shows that all of the shorter term averages (black) are still above and sitting on the flat longer term averages (red). So we are not in an extreme down trend yet. Time to be defensive until the primary trend becomes clear. Remember, by definition,   a trend follower only identifies a top (or bottom) after it has occurred.

Futures very weak–top of right shoulder complete?

GMI6/6
GMI-R10/10
T210877%

Tuesday was the 13th day of the current QQQQ short term up-trend.   With a big down opening coming, I must watch key support levels.   A weekly chart of the the major indexes suggests we may have completed the top of the right shoulder of a head and shoulders top.   The longer term up-trend of the QQQQ will turn negative for me with a close of the QQQQ below 46.17 . The comparable figure to watch on the Dow is a close below 10,480.   The 30 week average (red line) is about as flat as one can get, meaning we could be in a market of whipsaws for a while.   However, if the 30 week   average for these indexes begins to decline, I will exit all markets.   Note the potentially bearish weekly chart of the Dow below (click on chart to enlarge).