When everyone is so bearish and expecting the worst, it is time to expect the opposite. Last week, the Investor’s Intelligence Survey of letter writers and advisers actually showed more bears than bulls (38% vs. 29%, percents rounded). This is an exceedingly rare phenomenon and should have told us all that the market would rally. The survey is known as a contrary indicator, when there are many bears, the market goes up, presumably because many persons have already sold or are afraid because stocks have declined. When there are more than 50% bulls, it is time to start looking for a market decline. I am posting more explanations these days because I have a new class of undergraduate students who are new to these concepts.
Meanwhile, the GMI is 4 (one more flat or up day could turn it to 5) and the more sensitive GMI-R is at 8. 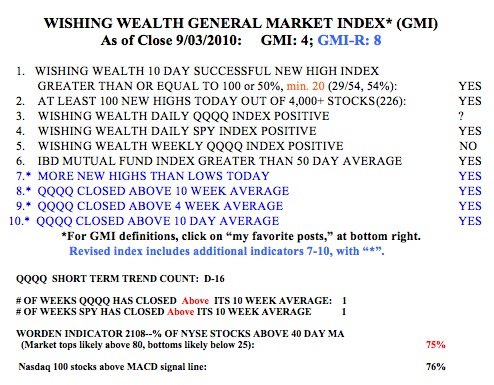 It is now time for me to close out my few short positions and start going long. There are just too many stocks breaking out. There were 226 new 52 week highs on Friday in my universe of 4,000 stocks. This is the most new highs since August 9 (229). While the QQQQ short term trend is still down, by my count, it may end at Friday’s day 16 (D-16) if we have a flat or up day in the index on Tuesday. Both the SPY and DIA have closed above their critical 10 week averages, the level at which I can begin to trade profitably on the long side. 76% of the NASDAQ 100 stocks closed with their MACD above its signal line, a sign of near term strength. And the Worden T2108 indicator is now at 76%, getting close to overbought territory, but this indicator can remain around 80% for months. The T2108 measures the percentage of all NYSE stocks that closed above their 40 day simple moving averages. It behaves like a pendulum of the market, swinging from overbought to oversold…….
As you know, I think the IBD approach to trading stock is quite effective. My strategy is to select stocks from the IBD 100 list, the top 100 stocks that meet the IBD CAN SLIM criteria. I then time the entry according to my own trading rules. The IBD100 list is published every Monday (this week on Tuesday) and is also available on their website for persons who subscribe to the newspaper. I am always amused how some traders dismiss the IBD100 list as containing stocks that have already passed their time. They say that when a stock appears on this list, it is too late to buy them. I think the evidence does not support this assertion. IBD100 stocks often outperform most other stocks, except during a market decline when these growth stocks can fall more.
From time-to-time, I record the first 10 IBD100 stocks on the list and compare their performance to other stocks. I did this for the top ten stocks on the list published on Monday, July 12. 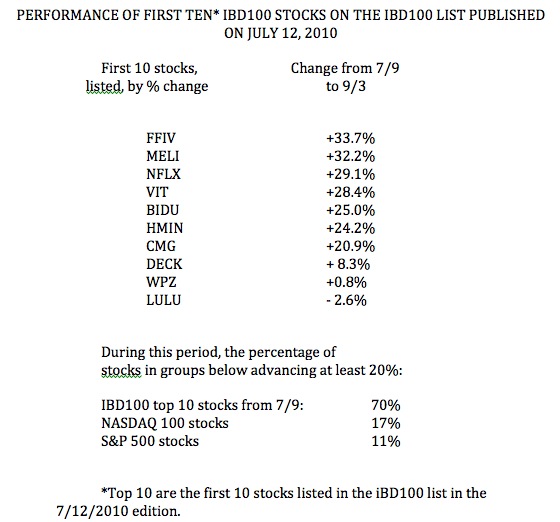 The top ten stocks are the first ten listed in the IBD100 table published each Monday, and presumably the most promising. I tracked the change in these ten stocks from the preceding Friday’s close (7/9) through last Friday. This table (click on to enlarge) shows the extraordinary out-performance of the ten IBD100 stocks. 90% (9/10) of these stocks rose in this period, with 70% rising 20% or more. In comparison, only 17% of the NASDAQ 100 stocks and 11% of the S&P 500 stocks rose at least 20%. This performance of the top ten IBD 100 stocks occurred while the QQQQ (NAASDAQ 100 index ETF) advanced 8%. While I do not necessarily concentrate my purchases among the top ten stocks on the IBD100 list, I do tend to concentrate on stocks that have appeared on the list or in the IBD New America daily columns. Almost every Friday, the New America page lists an archive of the companies written about during the past few months. I use this archive to update a watch list of promising stocks to follow. The first ten stocks on today’s IBD 100 list (published on Tuesday this week) are, in order: NFLX, ARUN, BIDU, PCLN, JKS, PPO, MELI, TSL, VIT, FFIV. I already own some of these. It will be interesting to see how these stocks perform over the next month.