I presented last night at an investment group in Bethesda, Maryland. I was very gratified by the response of the mostly boomer audience to my plea for providing financial literacy education to college students. Moreover, at the beginning of my talk I polled the audience of about 40 people regarding whether they typically would buy a stock that was trading at a new price high. Not a single person raised their hand. I then went on to tell them that I concentrate virtually all of my buys on stocks that are at all-time highs! If you want a stock that is going to the moon, the best place to look is the daily new high list. A stock that goes from 20 to 100 hits a lot of new highs along the way!!
A number of people have written that they do not see the “Stocks I’m Watching” section to the lower right of this blog. I think the problem is that if you receive this blog automatically by email, it does not contain all of the additional information that is on the page. Please go to the URL (wishingwealthblog.com) to get all of the information.
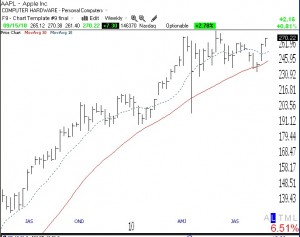
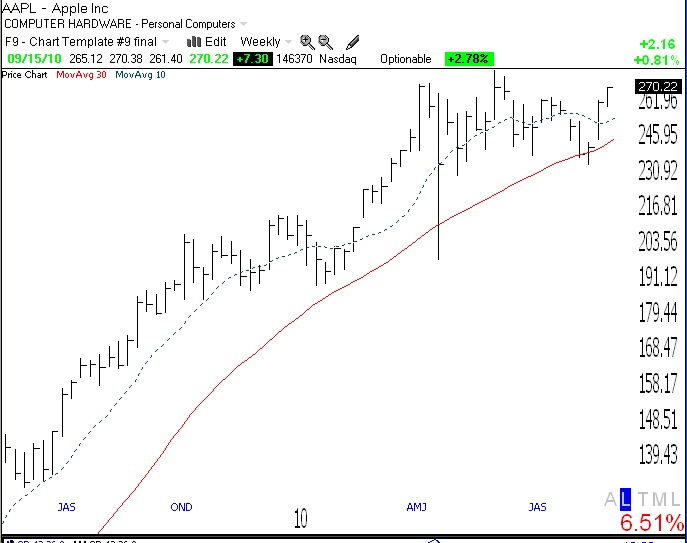
Finally, when the leaders like NFLX and AAPL are rising, it bodes well for the market. AAPL is now back above its 10 week average. AAPL remains in a Stage 2 up-trend, above its rising 30 week average (red line) and its 10 week average (blue dotted line). Note that it found support at the 30 week average and has now bounced nicely. As long as it stays above its 10 week average, I will hold some AAPL. Click on this weekly chart to enlarge.