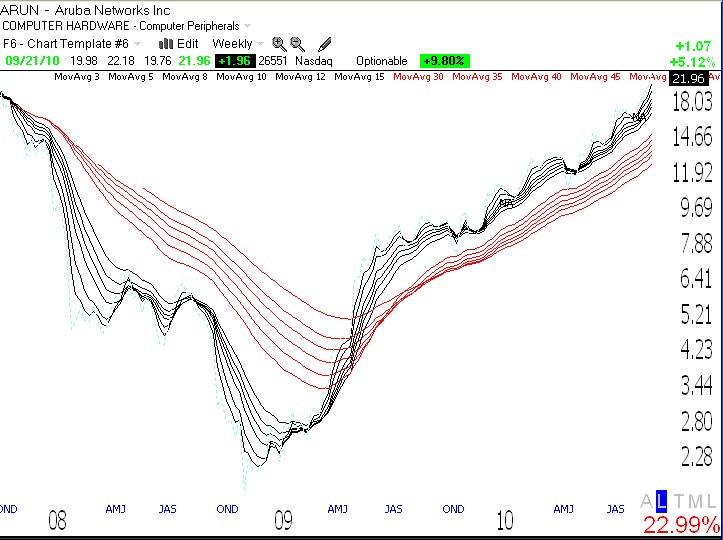
All indicators remain positive. Riding this up-trend. Another IBD 100 rocket stock near its all-time high: ARUN, (Click on chart to enlarge.)
Stock Market Technical Indicators & Analysis
All indicators remain positive. Riding this up-trend. Another IBD 100 rocket stock near its all-time high: ARUN, (Click on chart to enlarge.)
What a day Monday was–the best for my accounts in years. AAPL broke out and most of my stocks climbed. There were 392 new 52 week highs in my universe of 4,000 stocks, the most since last April. But last April marked the end of a major 13 month rise off of the 2009 bottom. We are just breaking out now, however, so we may have a long up-trend in front of us. With all of the negative sentiment around us and the apparent reluctance of people to embrace this rally, I think this up-trend has legs. AS a tend follower, I jump on this trend and ride it until after it ends.
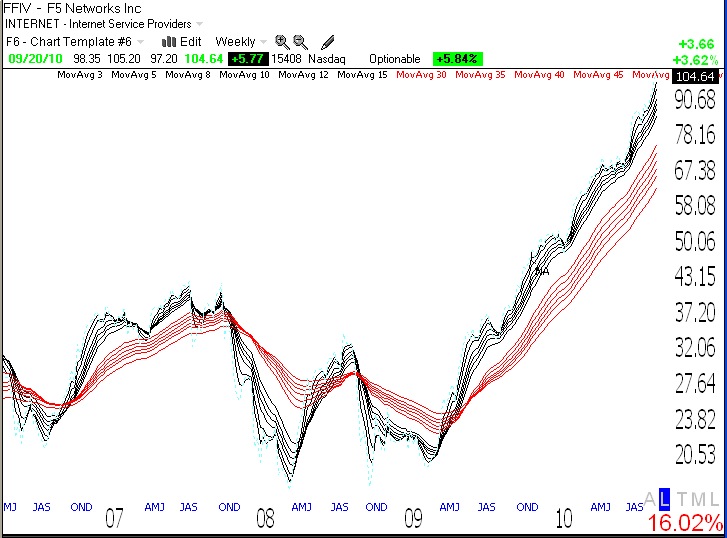
The GMI remains at 6 (of 6) and the GMI-R at 10 (of 10). The only indicator that I track that is a little troubling is the T2108, now at 82%, and close to overbought levels. But the T2108 can stay above 80 for a while. Below is the weekly GMMA pattern of another rocket stock, FFIV. Unfortunately, I did not hold it long enough. Note the “NA” on the chart (click on to enlarge) shows when IBD wrote about FFIV last December in their daily New America column about a promising company. The stock has doubled since then. The time to buy a stock is when it rockets to a new all-time high like FFIV did last November, around $47. The stock closed Monday at $104.64. I keep a watch list of New America companies. People who refuse to buy stocks at new highs miss out on the rocket stocks. Jesse Livermore used to say that stocks are never too high to buy (or never too low to sell short). He was the consummate trend follower.
With options expiration behind us, the next major event that may cause the stronger growth stocks to go higher is the end of quarter mutual fund window dressing. This event will be followed by release of quarterly earnings beginning in mid-October, followed by election results. All of these events might give the market a reason to rise, but we may have the typical October swoon somewhere in here. But with the GMI at 6 (of 6), I remain long in my IRA and 100% invested in my university pension. 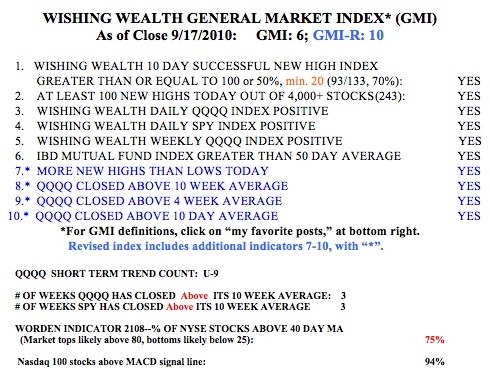 The QQQQ short term up-trend has now completed 9 days (U-9) and the QQQQ and SPY have now closed above their 10 week averages for three weeks. The Worden T2108 indicator is at 75%, which is high but not at an extreme over-bought level yet. 94% of the Nasdaq 100 stocks closed with their MACD above its signal line, a sign of short term strength. While the media pundits appear to be focusing on the idea that the S&P500 index is at the top of its recent trading range, it appears to me that tech stocks, as measured by the QQQQ have already broken out of their range. Tech stocks may lead the market higher, with so many new developments exciting people, such a cloud computing (CTXS, FFIV) and electric cars (PPO, SQM). And the fact that such market leaders as PCLN, NFLX, CMG and AAPL continue to rise, bodes well for the market.
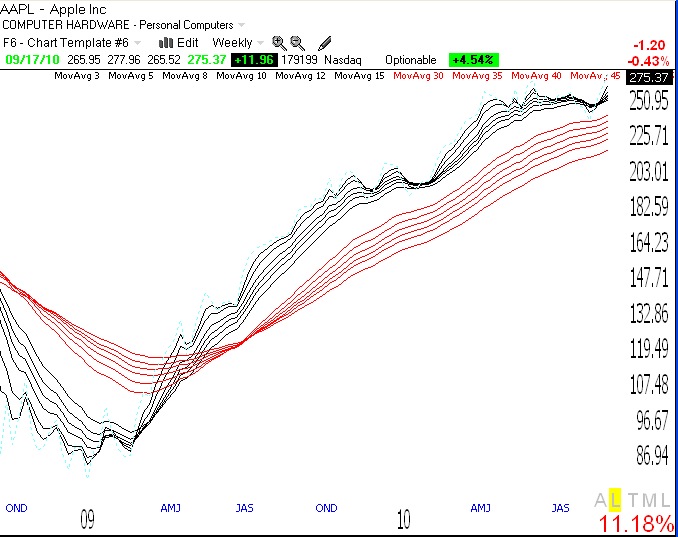
A major characteristic of rocket stocks in strong up-trends is that their short term averages are well above their rising longer term averages. I think that the weekly GMMA provides an extraordinary way for identifying such stocks. AAPL provides a great example, below. Note that this weekly chart (click on to enlarge) has all of the shorter term averages (black) well above their rising longer term averages (red). AAPL has consolidated the past 5 months but appears to be getting ready to break to all-time highs. I own some AAPL, and if it breaks out, we could see a strong move up. This weekly GMMA chart shows the typical chart pattern of all rocket stocks that I buy.