This is one of those times when I am very unsure of what to do. On the one hand, my market indicators remain strong, with the GMI at 5 (of 6) and the more sensitive GMI-R at 8 (of 10). Clearly the major indexes I follow remain in long and short term up-trends. On the other hand, we have the incredibly weak municipal bond sector, that I wrote about early last week. The municipal bond ETFs remain in a solid down-trend, although they have rebounded last week from their yearly lows. I suspect they will hit resistance this week and resume their down-trends.
The weakness in the municipal bond sector seems to me to be the tip of the iceberg, reflecting the huge underlying deficits in state and local governments. If the talk of changing the law to allow states to declare bankruptcy is true, and it happens, we can expect a huge disruption to the local economies as state and local government workers find their jobs and health and pension benefits disappearing. Even if the change does not become law, the debate surrounding this issue will sensitize investors to the massive financial problems faced by states and cities. Within this scenario, I suspect the market could face tough sledding. With the municipal bonds already collapsing with huge volume selling by the institutions, I suspect these issues to become more visible shortly.
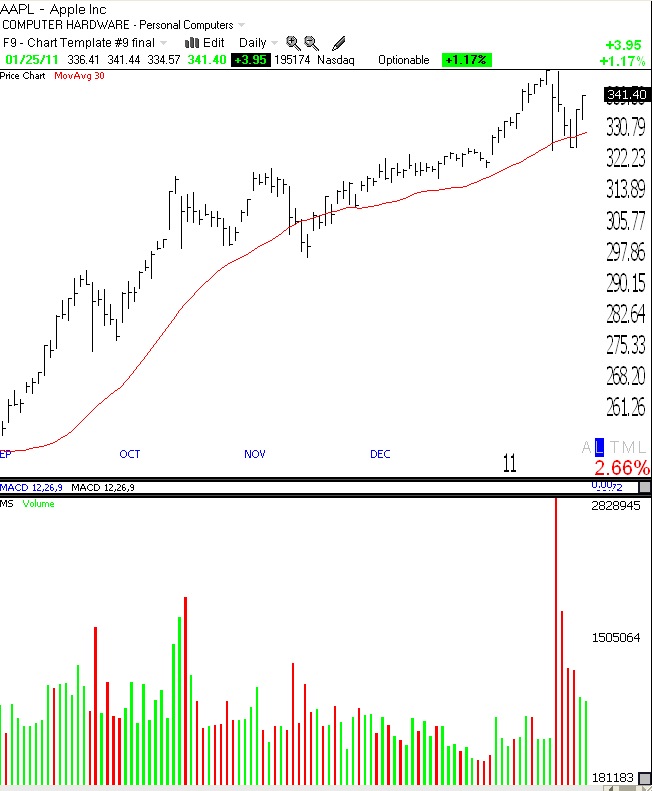
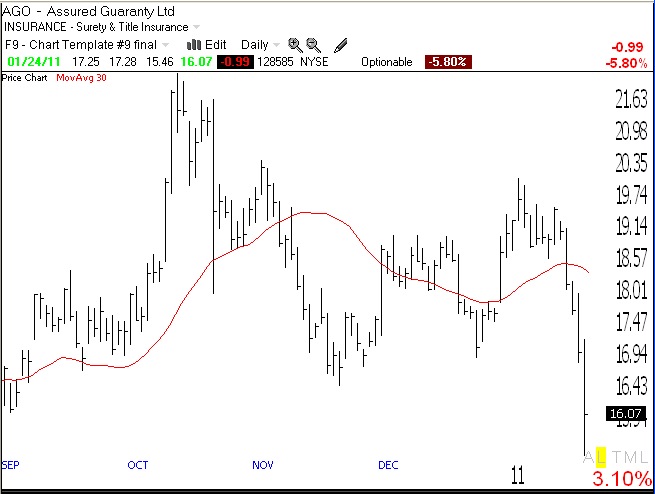
So, what to do? Last week, I sold out of my tech stocks and bought some of the bearish inverse ETF’s for the tech indexes. The post-earnings release weakness in GOOG and AAPL suggested to me that these stocks may have crested for now. And when a favorite like FFIV falls almost 30% in one day because of disappointing earnings, one can see that investor psychology may now be on the sell side. I also bought puts on AGO, the insurer of municipal bonds. In the sub-prime debacle, the insurers of mortgages collapsed when the underlying insured securities did.
I am a chicken and would rather get out quickly and get back in after the dust settles. I do not mind if I am wrong. Every loss brings me to the next gain. Regardless, I would not hold municipal bonds at this time. And long term government bonds may also suffer as interest rates move up. The big question is as the wealthy flee municipal binds, where will they invest the proceeds?
Did someone say dividend paying large caps? For clues, I am going to watch some of the ETF’s that focus on this sector. All of these have advanced 4% or more since December 1: FDD,LVL,DWX,IDV,PID,FGD,GULF,VIG. All but GULF have current dividend yields of at least 2%. The next step is to research their holdings. I like to do this on the yahoo finance site. For example, here is the profile for FDD. Once you look at that, just click “holdings” on the left side of the site to get an idea of the portfolio of that ETF.
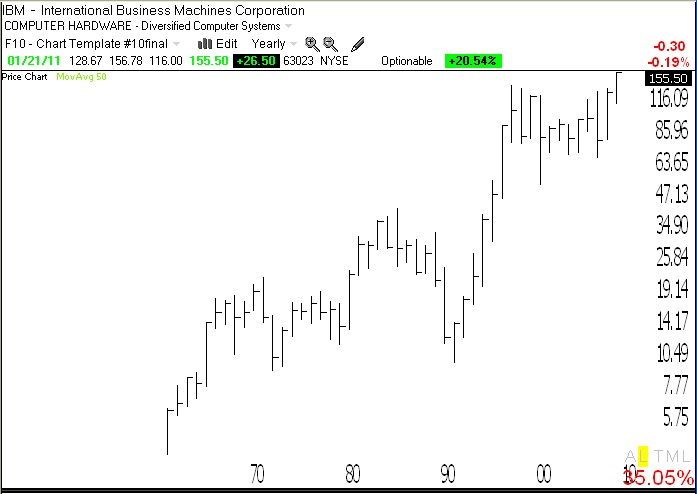
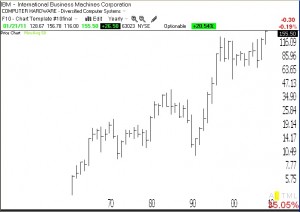
By the way, one stock that persons fleeing municipal bonds may flock into is trusted Big Blue. IBM hit a new all-time high last week. Furthermore, as this monthly chart shows, IBM has emerged from a 12 month consolidation.
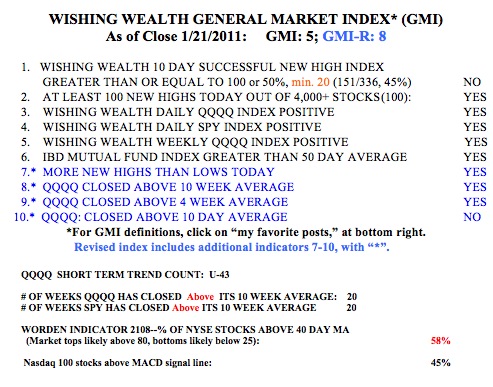
As I said above, the GMI and GMI-R remain strong (click on table to enlarge). These indicators, however, can only confirm a change in trend after it has occurred, so the long and short term trends remain up, for now. 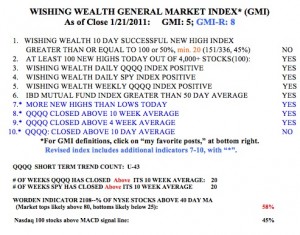 Note, however, that there were exactly the minimum number of new highs on Friday, 100, and that a down day on Monday will likely return the GMI to a reading of 4. The QQQQ has now been in its short term up-trend for 43 days, and with the exception of a preceding 2 day down-trend, for another 51 days. Thus, the QQQQ has been in a short term up-trend for 94 of the past 96 days. This run is reflected in the fact that the QQQQ ETF and the S&P 500 ETF (SPY) have closed above their critical 10 week averages for 20 straight weeks. It is my experience that as long as these indexes stay above their 10 week averages, I am likely to make money by being long stocks. The Worden T2108 Indicator (% of NYSE stocks above their 40 day moving average) is at 58%, in neutral territory. Readings near 80% are typical at market tops, and readings below 20% tend to occur near bottoms. The current reading is in the neutral area, down from a high of about 72% in mid-January. 45% of the Nasdaq 100 stocks closed Friday with their MACD above its signal line, down from 54% last week. A MACD above its signal line suggests a short term up-trend. I remain 100% invested in mutual funds in my university pension, but in cash or short in my trading IRA.